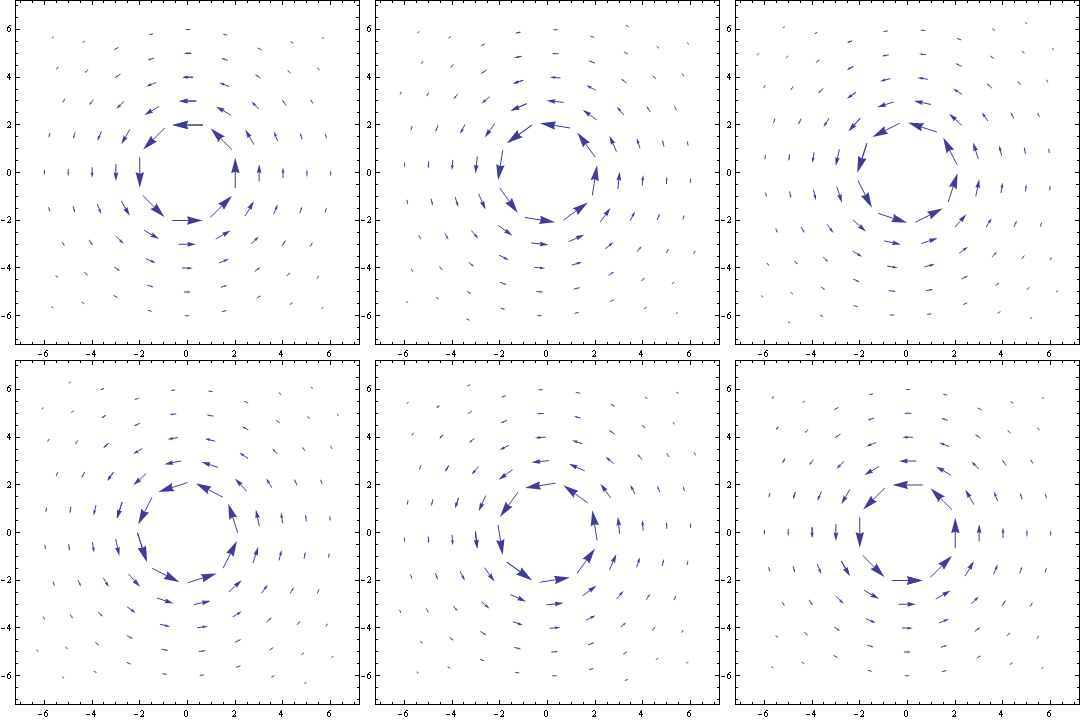
This answer is similar to @Edmund's, except with the rotation angle dependent on the radius:
pts2 = Table[
   Table[{x Sin[t], x Cos[t]}, {t, 0, 2 \[Pi], \[Pi]/(2 x)}], {x, 1, 8}];
a = Table[VectorPlot[{vx[x, y], vy[x, y]}, {x, -2 \[Pi], 2 \[Pi]}, {y, -2 \[Pi], 2 \[Pi]},
    VectorPoints -> (Flatten[Table[RotationMatrix[\[Phi]/x].# & /@ pts2[[x]], {x, 1, 8}], 1])], {\[Phi], 0, 2 \[Pi], \[Pi]/20}];

Export["vectors.gif", a]
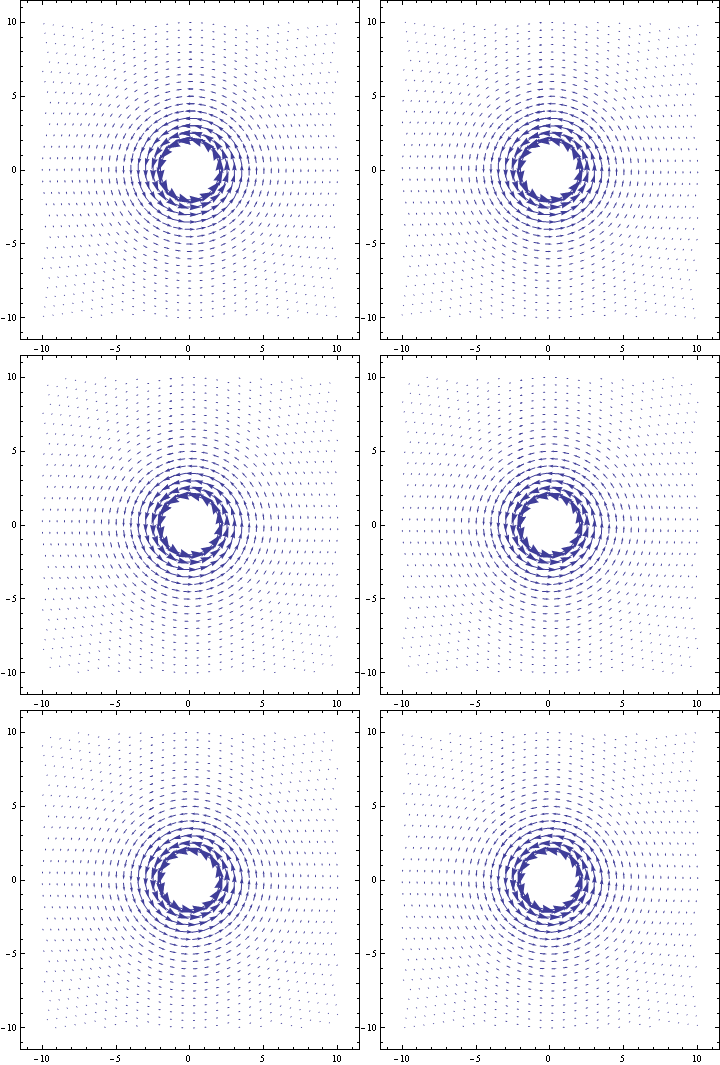
Edited to include an updated version in which it's easier to adjust the parameters:
numcircles = 20;
circlespacing = .5;
pointspacing = \[Pi]/4;
frameinterval = \[Pi]/20;

pts2 = Table[Table[{x Sin[t], x Cos[t]}, {t, 0, 2 \[Pi], pointspacing/x}], {x, 1, numcircles, circlespacing}];
a = Table[VectorPlot[{vx[x, y], vy[x, y]}, {x, -numcircles circlespacing, numcircles circlespacing}, {y, -numcircles circlespacing, numcircles circlespacing},
    VectorPoints -> (Flatten[
       Table[RotationMatrix[\[Phi]/n].# & /@ pts2[[n]], {n, Length[pts2]}], 1])], {\[Phi], 0, 2 \[Pi], frameinterval}];


