I observed that you included a timing before the plot, you missed a timing after the plot. Moreover, it appeared to me that TimeObject has quite an overhead, so I order to get "purer" timings, I replaced it by AbsoluteTime[]. This is what I used for timings:
points = 100;
f = {x, y} \[Function] x y;

opts = {PlotPoints -> points, MaxRecursion -> 0};
timing = Module[{i, start, results}, i = 0;
   results = Reap[
     Sow[{start = AbsoluteTime[], i++/points^2}];
     p = Plot3D[f[x,y], {x, -2, 2}, {y, -2, 2},
       Evaluate[opts],
       EvaluationMonitor :> Sow[{AbsoluteTime[], i++/points^2}]
       ];
     Sow[{AbsoluteTime[], i++/points^2}];
     ];
   {#1 - start, #2} & @@@ results[[2, 1]]];
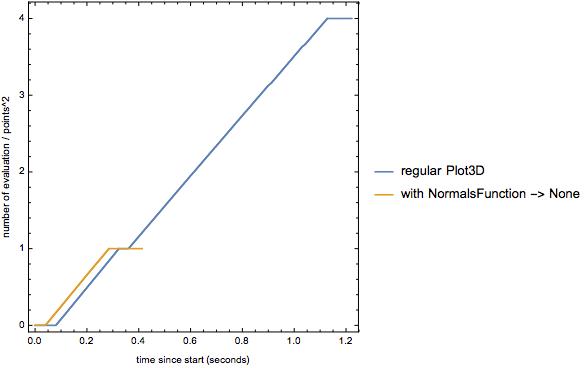
Then I got this
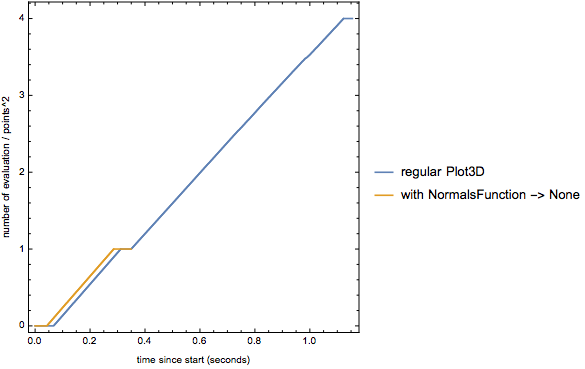
So it's not for sure that there is no plateau for the normal-free case. I'd say that a major part of the plateaus in the end are due to the mesh lines because they get shorter with Mesh -> None. These are the timings without the mesh lines:
Moreover, there is some time needed to compute the polygon index lists for the final GraphicsComplex. This won't need any point evaluations (the points are already evaluated), so this will also contribute the the plateaus.
Notice also the small shift between the yellow and the first blue ramp. This could be the infamous 50 ms that might be due to compilation of the normal function into "WVM".
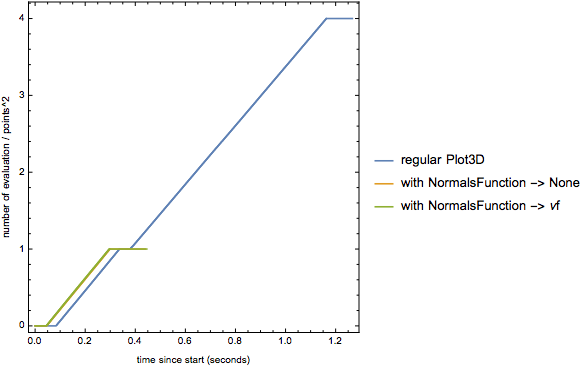
In the end, I still wonder what Mathematica is doing with the normal. In particular because you can get rid virtually all the time spent for "computing the vertex normals" by specifying your own NormalFunction like this:
νf = {x, y} \[Function] Evaluate[Cross @@ Transpose[D[{x, y, f[x, y]}, {{x, y}, 1}]]];
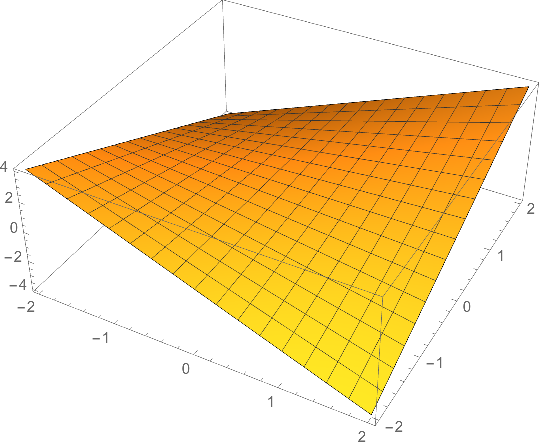
Plot3D[f[x, y], {x, -2, 2}, {y, -2, 2},NormalsFunction -> νf, Evaluate[opts]]
If the function f is sufficiently smooth, this will result in a perfect plot and the following timings


