An interesting issue was raised in comments to the following question: Monitoring Plot3D with a given number of plotpoints.
We were discussing the fact that a Plot3D expression with options PlotPoints -> points and MaxRecursion -> 0 evaluated the function to be plotted $4 \ \textrm{points}^2$, instead of simply $\textrm{points}^2$ times as I would have expected from the documentation. In fact, the docs for PlotPoints state that, with more than one variable, PlotPoints -> n specifies that $n$ initial points should be used in each direction. That, together with the MaxRecursion -> 0 should stop any attempts at further refinement.
Searching this site, I learned that the extra evaluations are used to calculate the "vertex normals" (see Why does Plot3D appear to traverse the points twice? and Henrik's answer there). This can be turned off using NormalsFunction -> None.
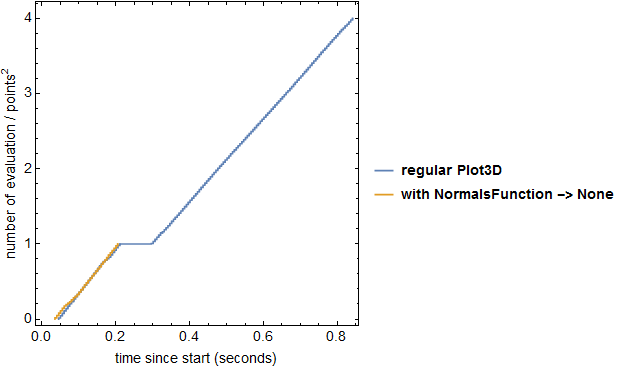
At first, however, I did not know about NormalsFunction and its effect, so I was playing around with a toy example, and I noticed a pattern in the function evaluations within Plot3D that had me scratching my head. I time-stamped each function evaluation and kept track of how many there were, as a ratio to points^2, which was my expected number of evaluations:
points = 100;

timing =
  Module[
    {i, start, results},
    i = 0;
    start = TimeObject[Now];
    results =
      Reap@
       Plot3D[
         1, {x, -2, 2}, {y, -2, 2},
         PlotPoints -> points, MaxRecursion -> 0,
         EvaluationMonitor :> Sow[{TimeObject[Now], i++/points^2}]
       ];
    {#1 - start, #2}& @@@ results[[2, 1]]
  ];
Requesting $100 \times 100 = 10,000$ points is perhaps uncommon, but it is not outside of the realm of possibilities, and it highlights the issue nicely.
I also generated a timingNoNormals by adding NormalsFunction -> None to the above code, keeping everything else identical. Here are the results, presented graphically:
ListLinePlot[
  {timing, timingNoNormals},
  Frame -> True, Axes -> False, AspectRatio -> 1, FrameStyle -> Black,
  FrameLabel -> {"time since start (seconds)", "number of evaluation / points^2"},
  PlotLegends -> {"regular Plot3D", "with NormalsFunction -> None"}
]

Two features here were surprising to me, which lead to my questions:
I was surprised to find that a good 3/4 of the evaluation time in
Plot3Dseems to be taken up by calculation of the vertex normals. This can use up quite a bit of time for even moderately costly function. When can we safely turn this "feature" off usingNormalsFunction -> None? Would it be safe to make that option persistent?Additionally, the delay between the first batch of function evaluations and the second, corresponding to that plateau in the blue plot above, was surprising to me. What is Plot3D doing in between? Building a
Graphics3Dobject?
