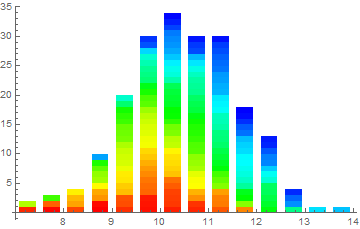
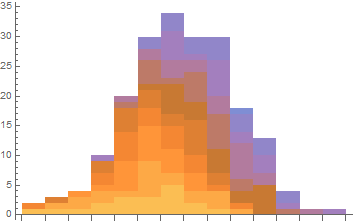
my interpretation:
data = MapIndexed[{#2[[1]], #} &, Join[
    RandomVariate[NormalDistribution[10, 1], 100] ,
    RandomVariate[NormalDistribution[11, 1], 100] ]];

hbins = HistogramList[data[[All, 2]]][[1]];
bw = -Subtract @@ hbins[[1 ;; 2]];
bins = Interval[#] & /@ Partition[hbins, 2, 1];
bindata =
  Function[{bin}, Select[data, IntervalMemberQ[bin, #[[2]]] &]] /@
   bins;
trange = MinMax@data[[All, 1]];
bar[x_, w_, colors_] :=
 Graphics[ {#[[1]], Rectangle[Sequence @@ #[[2]]]} & /@
   MapIndexed[ {#, {{x - w/2, First@#2 - 1}, {x + w/2, First@#2}}} &,
    colors ]]
Show[MapThread[
  bar[#1, .7 bw,
    Hue[Rescale[#, trange, {0, 2/3}]] & /@ #2[[All, 1]]] &,
  {Mean /@ Partition[hbins, 2, 1], bindata}], Axes -> True,
 AspectRatio -> 1/GoldenRatio, PlotRange -> All]
Edit, oh I knew there was a simpler way:
BarChart[HistogramList[data][[2]] // Transpose,
 ChartLayout -> "Stacked"]


