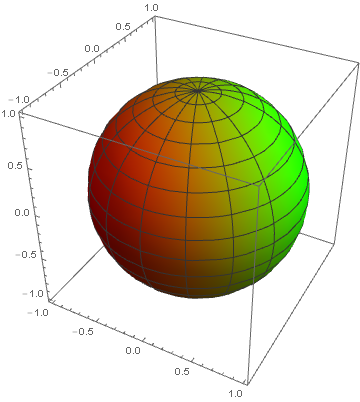
if you do not know the range a priori you can run the plot once to get it, then again to plot:
dist[x_, y_, z_] = Abs[x + y];
range = dist @@@
   Reap[ParametricPlot3D[{Cos[u] Cos[v], Sin[u] Cos[v], Sin[v]}, {u,
       0, 2 \[Pi]}, {v, -\[Pi]/2, \[Pi]/2},
      ColorFunction :> (Sow[{#1, #2, #3}] &)]][[2, 1]] // MinMax
{0.292893, 1.70711}
ParametricPlot3D[{Cos[u] Cos[v], Sin[u] Cos[v], Sin[v]}, {u, 0,
  2 \[Pi]}, {v, -\[Pi]/2, \[Pi]/2},
 ColorFunction :> (Blend[{{range[[1]], Red}, {range[[2]], Green}},
     dist[#1, #2, #3]] &)]
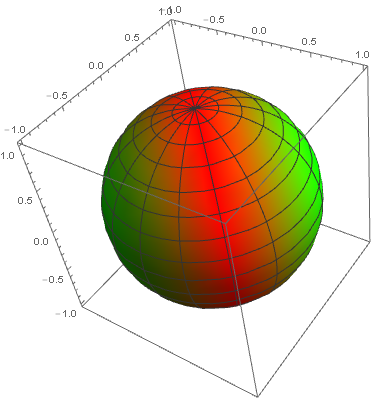
Note that the arguments passed to the color function are scaled coordinates ranging from zero to one over the graphics box. Most likely you want to set ColorFunctionScaling -> False (both ParametricPlot3D uses), then you get the expected range,
{3.56064*10^-14, 1.41421} (* 0 to Sqrt[2] *)
and plot:


