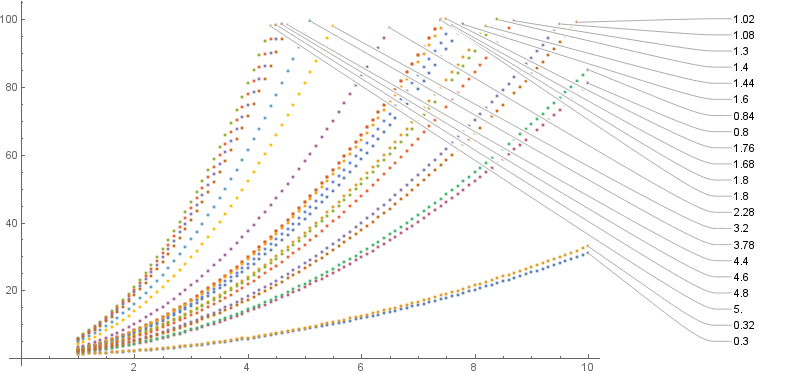
Using Callout with explicit positions for labels in the setting of PlotLabels combined with manual reordering of input data:
slopes = Sort@Table[i Round[Abs[Sin[i]], 0.1], {i, 1, 5, 0.2}];
mydata = Table[Select[Table[{x, 1 + slope * x^2}, {x, 1, 10, 0.1}], #1[[2]] <= 100 &],
   {slope, slopes}];

ordering ={1,2,21,20,19,18,17,16,15,14,13,11,12,3,4,10,9,8,7,6,5};
mydataordered = mydata[[ordering]];
slopesordered = slopes[[ordering]];
xpos = 12;
yrange = {5, 100};

ListPlot[mydataordered,
 PlotLabels -> MapIndexed[Callout[#,{xpos, Rescale[#2[[1]], {1, Length@mydata}, yrange]},
     mydataordered[[All,-1]][[#2[[1]]]],
     LeaderSize -> {{Automatic, Automatic, 0}, {30, 0 Degree}}]&, slopesordered],
 ImagePadding -> {{Automatic,200}, { Automatic, Automatic}},
 ImageSize -> 800, PlotRangeClipping -> False]
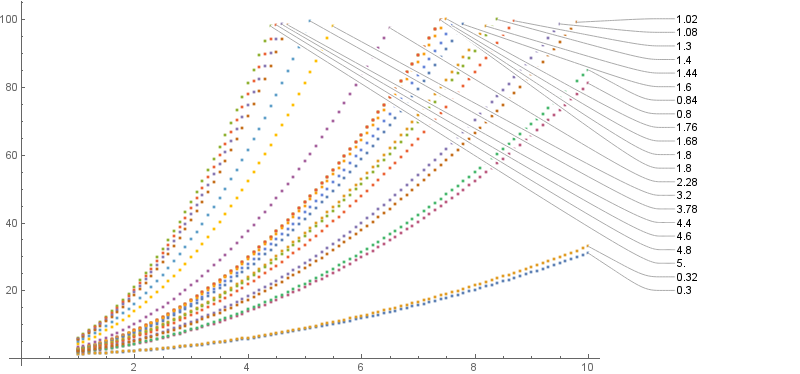
Use xpos = 11; yrange={20, 100}; to get
Alternatively, use
ListPlot[MapIndexed[Callout[#, slopesordered[[#2[[1]]]],
    {xpos, Rescale[#2[[1]], {1, Length @ mydata}, yrange]},
     mydataordered[[All,-1]][[#2[[1]]]],
  LeaderSize -> {{Automatic, Automatic, 0}, {30, 0 Degree}}]&, mydataordered],
ImagePadding -> {{Automatic, 200}, {Automatic, Automatic}},
ImageSize -> 800, PlotRangeClipping -> False]
to get the same result as above.
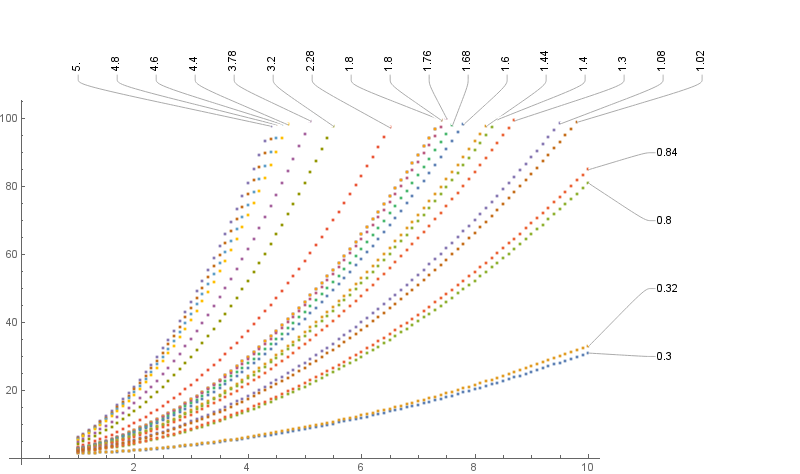
Update: An alternative layout for the Callouts:
combined = Transpose[{mydata, slopes}];
{top, left} = Pick[combined, #[[1, -1, 1]]  < 9.9 & /@ combined, #]&/@{True, False};
{datatop, slopestop} = Transpose[SortBy[top, #[[1,-1,1]]&]];
{dataleft, slopesleft} = Transpose[SortBy[left, #[[1,-1,-1]]&]];
dL = MapIndexed[Callout[#, slopesleft[[#2[[1]]]],
 {11, Rescale[#2[[1]], {1, Length @ dataleft}, {30, 90}]}, dataleft[[All,-1]][[#2[[1]]]],
 LeaderSize -> {{Automatic, Automatic, 0}, {10, 0 Degree}}]&, dataleft];
dT = MapIndexed[Callout[#, slopestop[[#2[[1]]]],
 {Rescale[#2[[1]],{1, Length @ datatop}, {1, 12}], 110}, datatop[[All, -1]][[#2[[1]]]],
 LeaderSize -> {{Automatic, Automatic, 0}, {10, 90 Degree}}]&, datatop];

ListPlot[Join[dL,dT], ImagePadding -> {{Automatic,200},{ Automatic, 100}},
 ImageSize->800, PlotRangeClipping->False]


