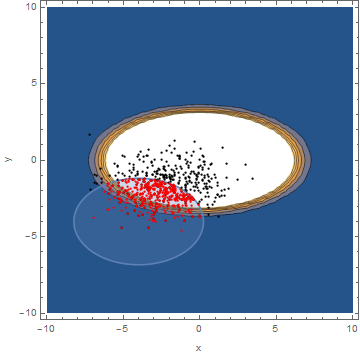
Here is how I solved the 2D example:
The function below implements the ISMC for normal distributed random variables.
Input data: failure finction gx, sample number of points, distribution data (e.g. nrvarsvec) and an aproximate coordinate of the failure region (e.g. nrvarsvecfail).
MCIS[gx_, npoints_, nrvarsvec_ , nrvarsvecfail_] :=
 Block[{xfailed = {}, nrvars, w, fx, wx, hx, wi, dim, u, x, PostProc,
   beta},
  nrvars = Length[nrvarsvec];
  u = RandomVariate[UniformDistribution[{0, 1}], {npoints, nrvars}];
  x = Table[Table[InverseCDF[NormalDistribution[nrvarsvecfail[[i, 1]],nrvarsvecfail[[i, 2]]], u[[j, i]]], {i, 1, nrvars}], {j, 1, npoints}];
  fx = Table[Product[PDF[NormalDistribution[nrvarsvec[[i, 1]], nrvarsvec[[i,2]]], x[[j, i]]] , {i, 1, nrvars}], {j, 1, npoints}];
  hx = Table[Product[PDF[NormalDistribution[nrvarsvecfail[[i, 1]], nrvarsvecfail[[i, 2]]], x[[j, i]]] , {i, 1, nrvars}], {j, 1, npoints}];
  w = fx/hx;
  If[nrvars == 1, x = Flatten[x];];
  wi = Table[0, {Length[x]}];
  PostProc = Table[0, {npoints}, {2}];
  Table[
   wi[[i]] = w[[i]] gx[x[[i]]];
   PostProc[[i, 1]] = i;
   beta = -InverseCDF[NormalDistribution[0, 1], Mean[wi]];
   PostProc[[i, 2]] = beta;
   If[gx[x[[i]]] == 1, AppendTo[xfailed, x[[i]]]];
   , {i, 1, Length[x]}
   ];
  {PostProc, x, xfailed, beta}
  ]
Solving the problem:
Xfail = {-2.05, -1.48};
npoints = 1000;
nrvarsvec = {{mean0, sdev0}, {mean1, sdev1}};
nrvarsvecfail = {{Xfail[[1]], sdev0}, {Xfail[[2]], sdev1}};

GX[{X1_, X2_}] := If[gx[X1, X2] <= 0, 1, 0];
pl = ContourPlot[gx[x1, x2] == 0, {x1, -10, 10}, {x2, -10, 10}];
{PostProcIS, xIS, xfailedIS, betaIS} =
MCIS[GX, npoints, nrvarsvec, nrvarsvecfail];
Print["Monte Carlo importance sampling reliability index= ", betaIS];
Show[Plot[reliabilityindex, {x, 0, npoints}],
 ListPlot[PostProcIS, AxesOrigin -> {0, 0}], Frame -> True,
 FrameLabel -> {"Number of samples", "Reliability Index"}]

rds = ListPlot[Table[{xIS[[i, 1]], xIS[[i, 2]]}, {i, 1, Length[xfailedIS]}],PlotStyle -> {Black}];
rdsf = ListPlot[Table[{xfailedIS[[i, 1]], xfailedIS[[i, 2]]}, {i, 1,Length[xfailedIS]}], PlotStyle -> {Red}];
Show[cp, rp, rds, rdsf, PlotRange -> All, Frame -> True, FrameLabel -> {"x", "y"}]


