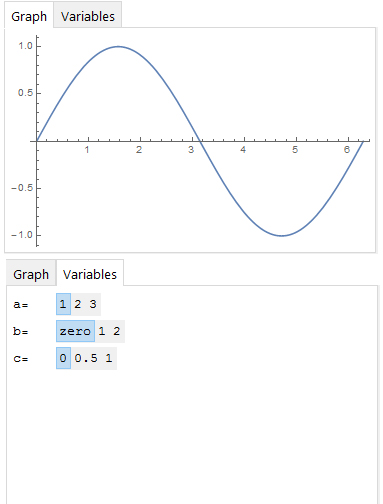
Pursuant to jjc385's comment, the ideal answer is
DynamicModule[{tab = 2}, TabView[{ "Variables" -> TabView[{"A" -> TableForm@{{"a=", SetterBar[Dynamic[a], Range@3]}, {"b=", SetterBar[Dynamic[b], {0 -> "zero", 1, 2}]}, {"c=", SetterBar[Dynamic[c], {0, .5, 1}]}} , "B" -> "Nothing here."}] , "Graph" -> Dynamic@Plot[Sin[a x + b] + c, {x, 0, 2 Pi}] }, Dynamic[tab]] ]
which is a little different than the prior code which produced
Now, the user can change several variables and the display only switches to the graph when the user tabs to it. Thanks!

