Update 2: The answers below addressed the question in OP's comment. From the accepted answer, it is now clear that removing the bottom of edge of rectangles is not needed.
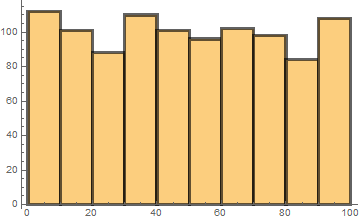
In that case, the option ChartBaseStyle gives the resired result (there is no need for custom ChartElementFunctions):
Histogram[data, ChartBaseStyle -> EdgeForm[Thickness[.01]]]
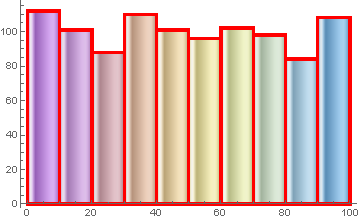
Histogram[data, ChartStyle -> "Pastel",
 ChartElementFunction -> "GlassRectangle",
 ChartBaseStyle -> EdgeForm[{Opacity[1, Red], Thickness[.01]}]]
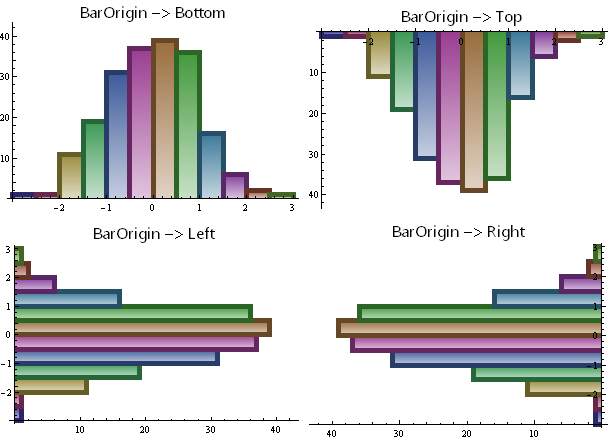
Update: The ChartElementFunction in the original post works only for the default setting for the option BarOrigin. The new function ceF2 works for arbitrary values for the BarOrigin option.
ceF2[cedf_: "GlassRectangle", o : OptionsPattern[]][col_: Black, thickness_: 3] :=
 Module[{or = Charting`ChartStyleInformation["BarOrigin"], ll = Tuples[#][[{1, 2, 4, 3}]]},
   ll = RotateRight[ll, Switch[or, Bottom, 0, Top, 2, Left, 3, Right, 1]] ;
   {ChartElementDataFunction[cedf, o][##],
    col, AbsoluteThickness[thickness], CapForm["Butt"], Line[ll]}] &
Examples:
Grid[Partition[Histogram[data, ChartStyle -> 1, ImageSize -> 300,
     PlotLabel -> Style["BarOrigin -> " <> ToString[#], 16, "Panel"],
     ChartElementFunction -> ceF2["FadingRectangle", "GradientOrigin" -> Top][
       Dynamic[Darker@CurrentValue["Color"]], 5],
     BarOrigin -> #] & /@ {Bottom, Top, Left, Right}, 2]]
Original post:
A more flexible chart element function that modifies built-in chart element functions to add thick lines:
ClearAll[ceF]
ceF[cedf_: "GlassRectangle", o : OptionsPattern[]][col_: Black, thickness_: 3] :=
  {ChartElementDataFunction[cedf, o][##],
   col, AbsoluteThickness[thickness], CapForm["Butt"],
   Line[Tuples[#][[{1, 2, 4, 3}]]]} &
Examples:
SeedRandom[42];
data = RandomVariate[NormalDistribution[0, 1], 200];

Histogram[data, ChartStyle -> 1, ChartElementFunction -> ceF[][]]
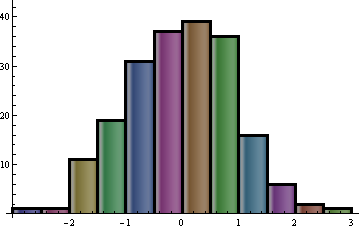
Histogram[data, ChartStyle -> 1,
 ChartElementFunction ->
  ceF["FadingRectangle"][Dynamic[Darker@Darker@CurrentValue["Color"]], 5]]
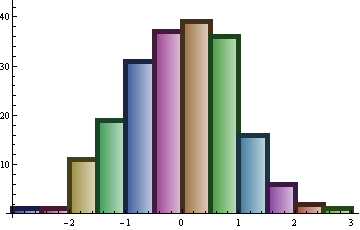
Histogram[data, ChartStyle -> 1,
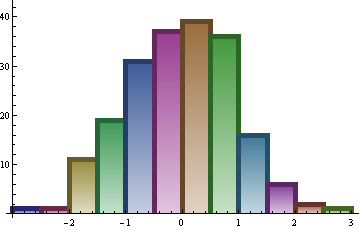
 ChartElementFunction ->
  ceF["FadingRectangle", "GradientOrigin"->Top][Dynamic[Darker@CurrentValue["Color"]], 5]]
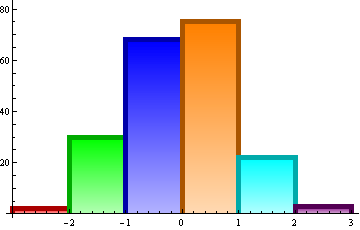
Histogram[data, 5, ChartStyle -> {Red, Green, Blue, Orange, Cyan, Purple},
 ChartElementFunction ->
  ceF["FadingRectangle", "GradientOrigin"->Top][Dynamic[Darker@CurrentValue["Color"]], 5]]
