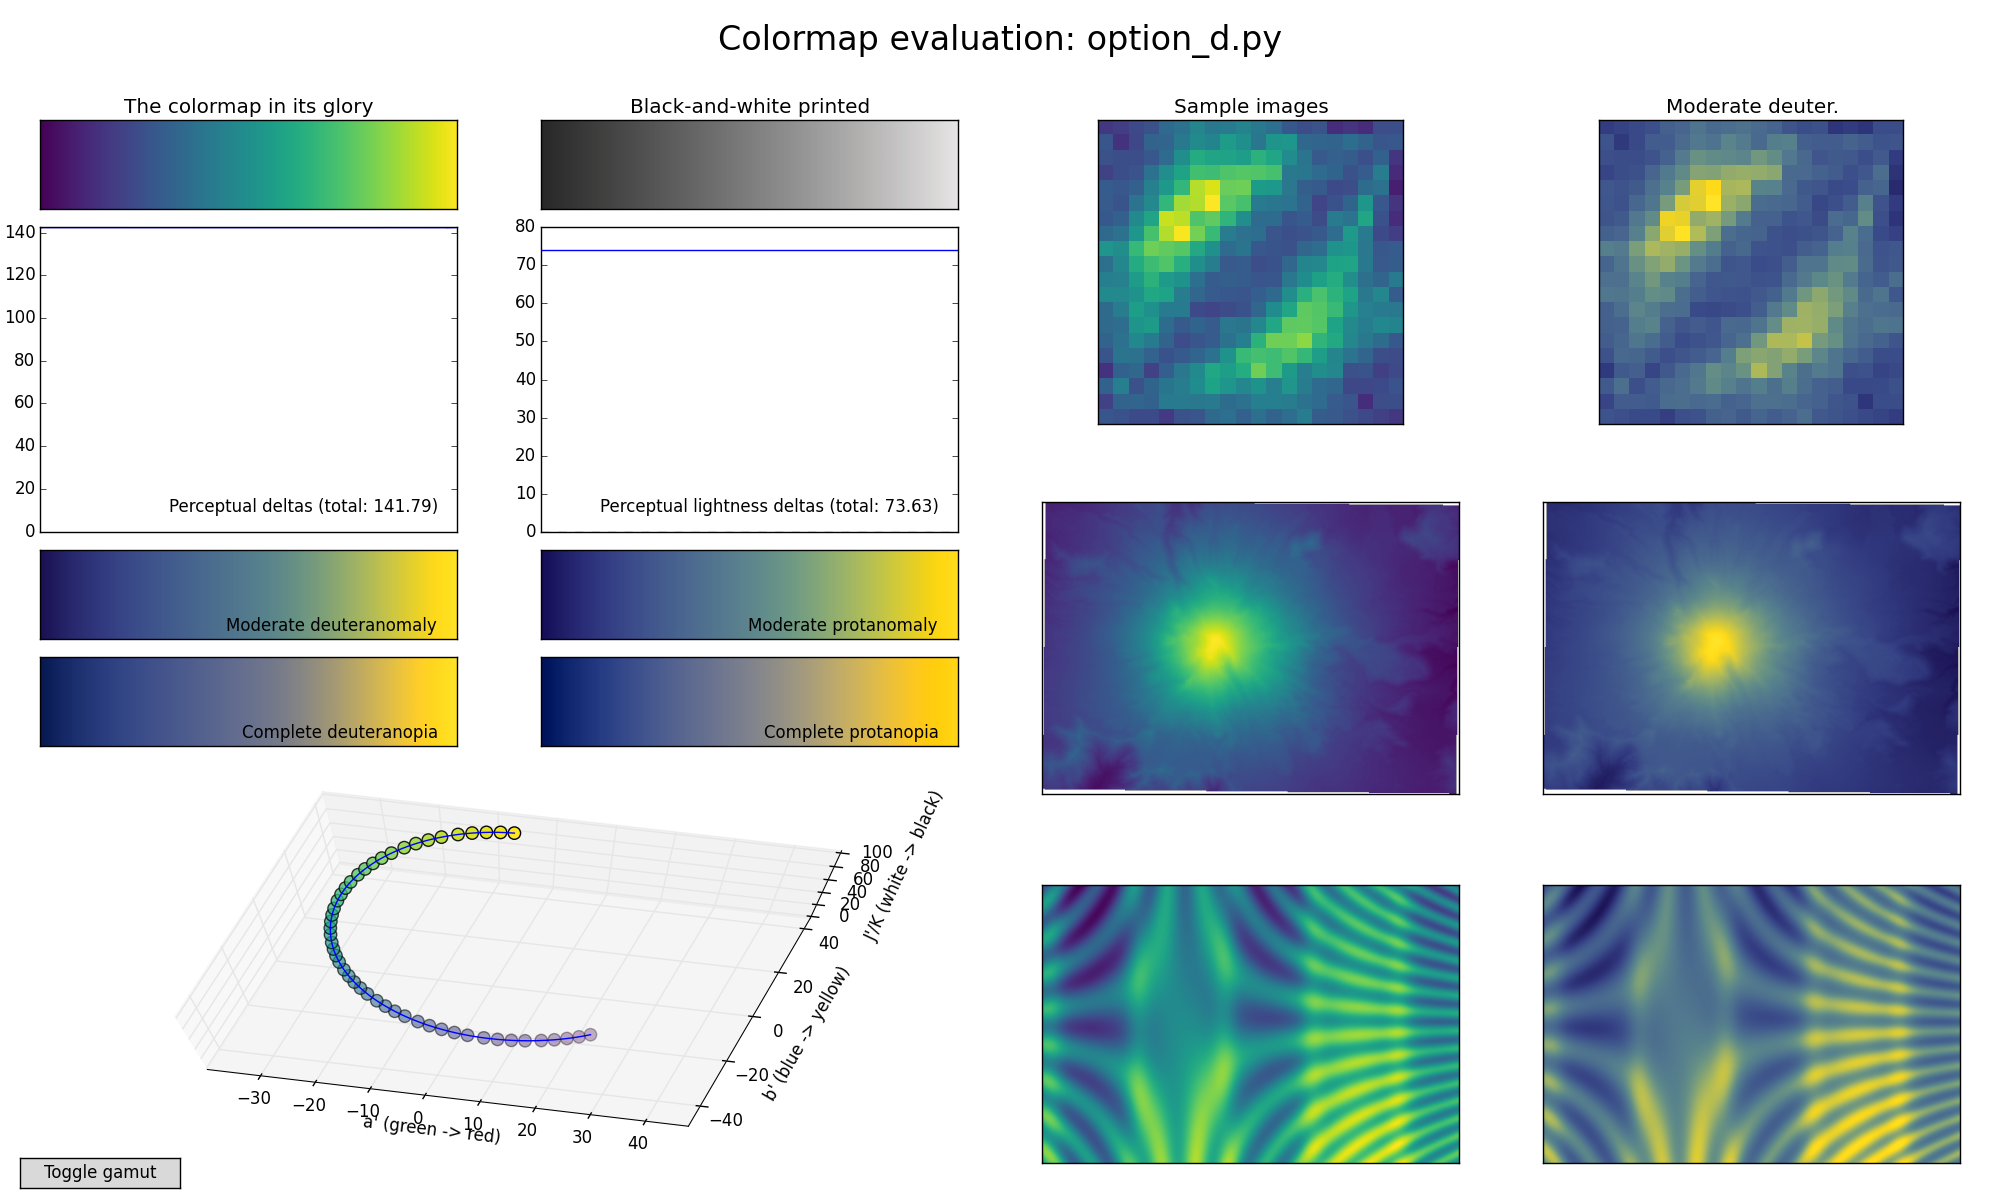
There are already good approaches for "better than standard" colormaps in MMA, which are optimized for a more linear perception between the visible colors and their underlying values, here in StackExchange: Is there an easy way to use Matteo Niccoli's perceptual color maps for 2D plots in Mathematica?
Nevertheless, those considerations can go even further into thinking of Colormaps that also include linear perception for persons impaired by deuteranopia or protanopia. Also the grayscale-printing can be optimized.
Have a look at: https://bids.github.io/colormap/
Example:
 (source: https://bids.github.io/colormap/)
Question:
Far down in the article, there are some hints to generate those maps using Python. How can those maps be generated and used in MMA? I am especially interested in "Option D (Viridis)".
What I have tried/found out so far:
On the article's website, I found a python script including a variable cm_data, which contains apparently RGB-Values (scaled from 0.0 to 1.0) in a structure like: [[R1,G1,B1],...,[Rn,Bn,Gn]]. I'm not familiar with parsing such a string into a useful List in MMA.
