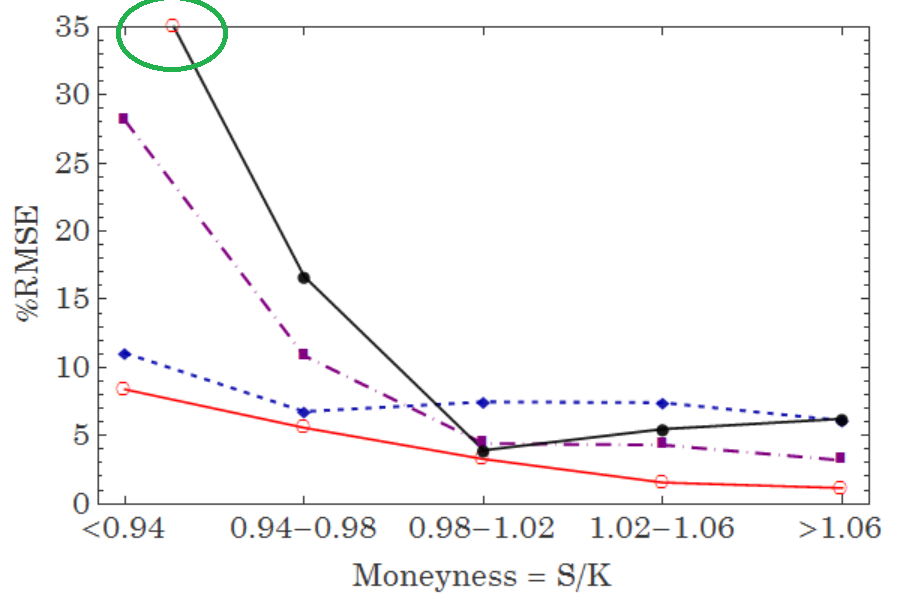
I am well aware I could simply increase the PlotRange to fix this, however, I'd like to keep the scale identical to some plots I compare this with. Also I haven't found anything about this and it only happens when I put a frame around my plots.
Initially I thought the outlying observation is styled just like the respective line, but that is not the case it seems.
plots were created with Mathematica 11
edit:
PlotRangeClipping False/True only allows to display the full red circle or clip it, but there do not seem to be any options to actually style (change color or shape of the marker) or remove any indication of clipping.

