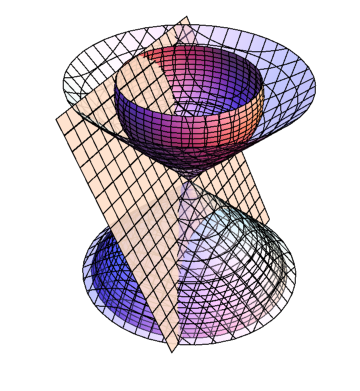
Can we show the Dandelin spheres scenario (shown by Hrhm for case of ellipse) for a hyperbola as well? I'm not happy with what we get to see of this on the net.
The double nappe/sheet of a cone is cut by a plane inclined at angle $ \beta < 2 \alpha $ ( cutting plane inclination to a generator of cone, cone vertex angle ) cutting both nappes with hyperbolas as intersecting arcs.
The Dandelin spheres are placed in each cone tangentially, foci outside directrix planes The cutting plane contacts spheres at foci so that focal distance difference from hyperbola is constant.
I can also do this using ContourPlot3D, however you can make it with a great image quality.
Proper choice of $\alpha, \beta$ so that the difference of line segments can be convincingly visualized.
EDIT 1:
Some changes from the following need to be made to see points of tangential contact and radius vectors in the plane at an arbitrary point on hyperbola.
{s1=5,s2=3,H=-1,al=.8,bt=-2,Z=11.5,PltLim=5.1};
snal=(s1+s2)/Z;al=ArcSin[snal];tnal=Tan[al];
S1=ContourPlot3D[x^2+y^2+(z+s1/snal)^2==s1^2,{x,-PltLim,PltLim},{y,-PltLim,PltLim},{z,-PltLim,PltLim}];
S2=ContourPlot3D[x^2+y^2+(z-s2/snal)^2==s2^2,{x,-PltLim,PltLim},{y,-PltLim,PltLim},{z,-PltLim,PltLim}];
Keg=ContourPlot3D[x^2+y^2 -z^2 tnal^2==0,{x,-PltLim,PltLim},{y,-PltLim,PltLim},{z,-PltLim,PltLim},ContourStyle-> Opacity[.35]];
Plne=ContourPlot3D[ z  ==-x Tan[bt]+ H,{x,-PltLim,PltLim},{y,-PltLim,PltLim},{z,-PltLim,PltLim},ContourStyle-> Opacity[.9]];
Show[{S1,S2,Keg,Plne},PlotRange->All, Boxed->False,Axes->None]

