I'm inspecting the Cantor Pairing function, that we can find on this link here.
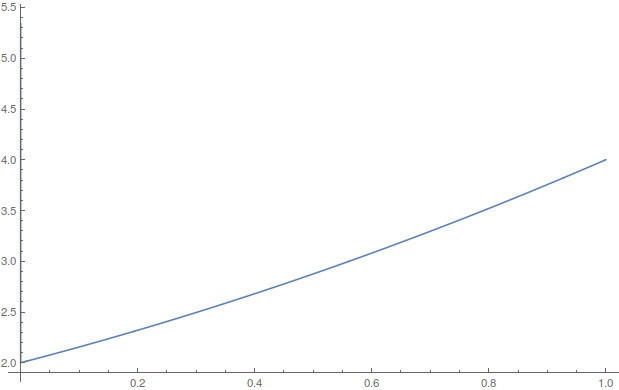
But the strange thing is that Mathematica is outputing a wrong result to me. The code below shows the strange behavior. When we plot the Q2N1 function, the y axis does not corresponds to the correct value. See:
Q2N0[q_] := (Numerator[q] + Denominator[q] + 1) (Numerator[q] + Denominator[q])/2 + Denominator[q]

Q2N[q_] := Q2N0[Rationalize[q]]

Q2N1[q_] := Q2N[N[q, 10]]

Q2N1[0.2]

Out[13]= 26

Plot[Q2N1[x], {x, 0, 1}]
As we can see, confronting the code with the plot, when x = 0.2 the correct value is 26, but Mathematica plot function returns a value near of 2.25. The truth is all returned values should be integers or very near to integers, so 2.25 could never be a result. Crazy.
Why this is happening? And, how can we have the correct output?

