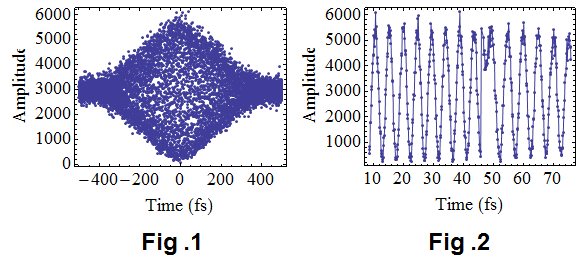
I have a non-uniform sampling data (in time domain) from a Michelson interference experiment, as shown in Fig 1. But it was not evenly sampled (the step length was not uniform), because of the imperfection in the experiment. Further, if we enlarge the figure, we can see some bad-sampled points in Fig. 2 (the plot of a[[3800 ;; 4300]]).
The horizontal axis is time in femto-second (10^-15 second). In frequency domain, the central wavelength is [Lambda] = 800 nm, and the corresponding central frequency should be c/[Lambda] = 310^8/(80010^-9) = 3.75*(10^14) Hz.
    SetDirectory[NotebookDirectory[]];
    name = "try.txt";
    a = Import[name, "Table"];
    ListLinePlot[a, PlotRange -> All, Joined -> False, Mesh -> Full,    Axes -> False, Frame -> True, AspectRatio -> .75,  LabelStyle -> Directive[Black, FontSize -> 18], FrameLabel -> {{"Amplitude", None}, {"Time (fs)", None}},  ImageSize -> {400, 300}]
My question is : how to carry out a Fourier Transform on this time - domain data, so as to obtain the spectral distribution. Any suggestion or help will be highly appreciated. Thank you all in advance.

