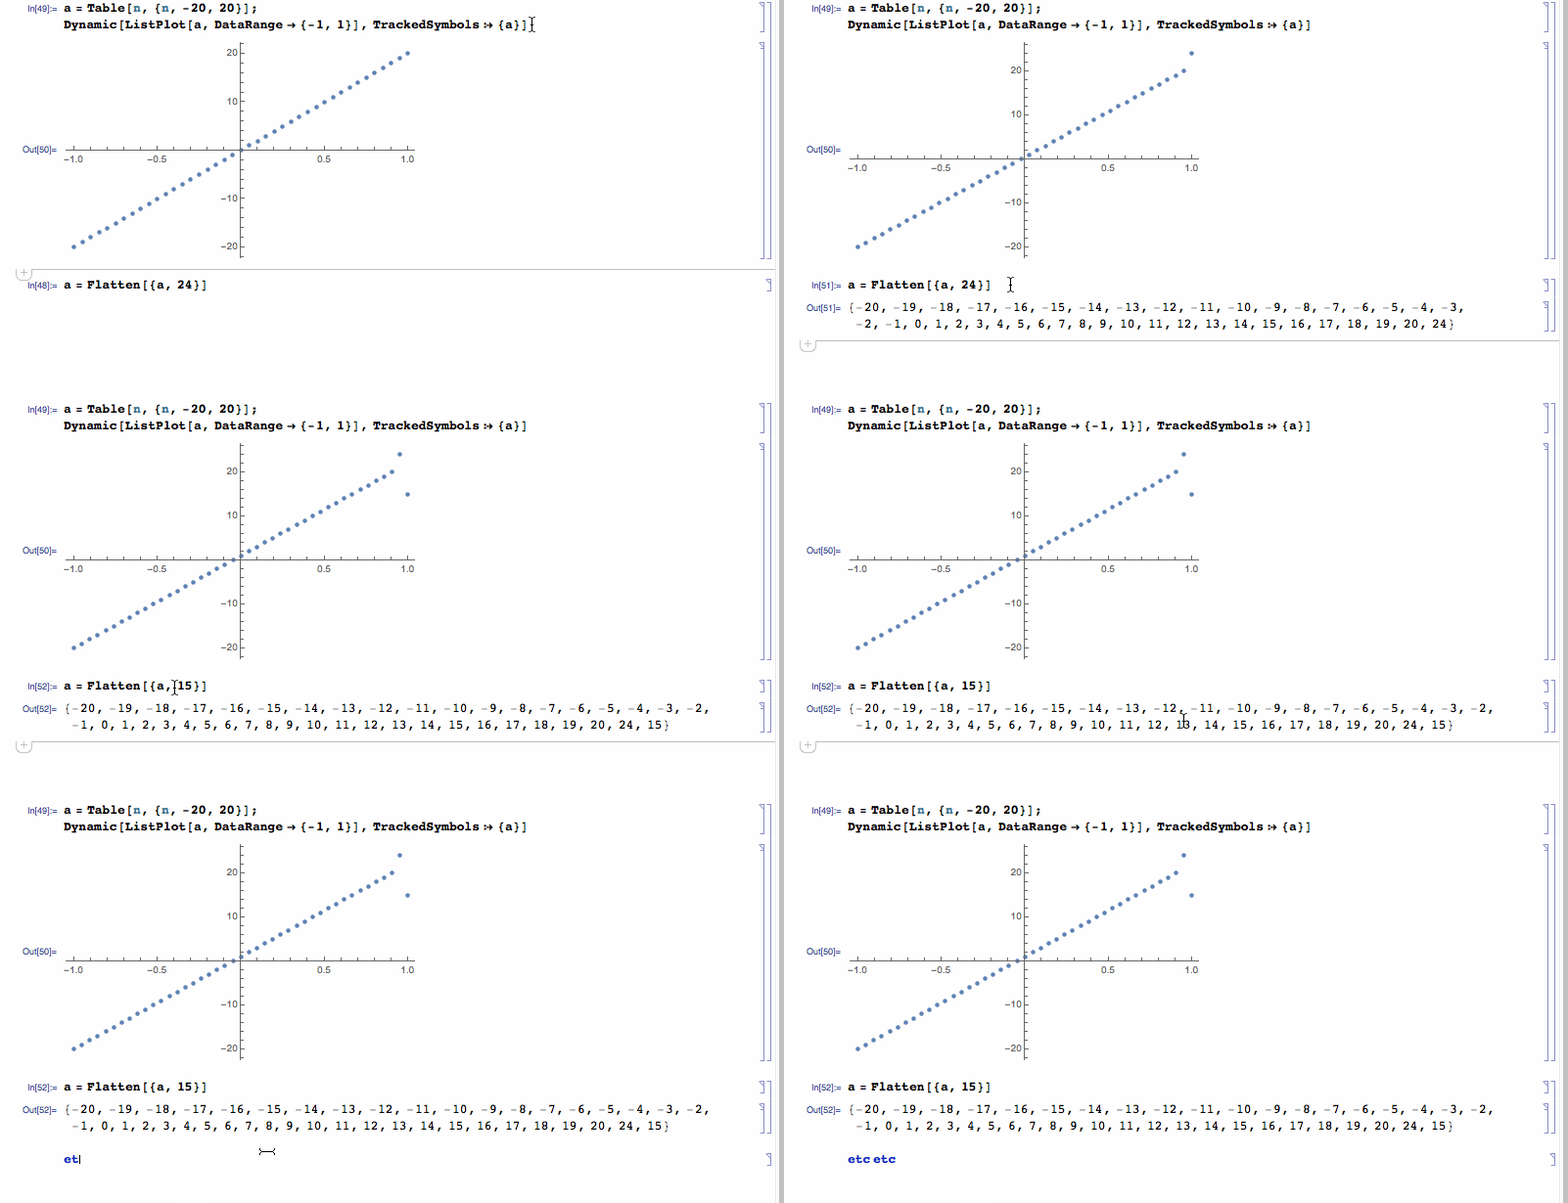
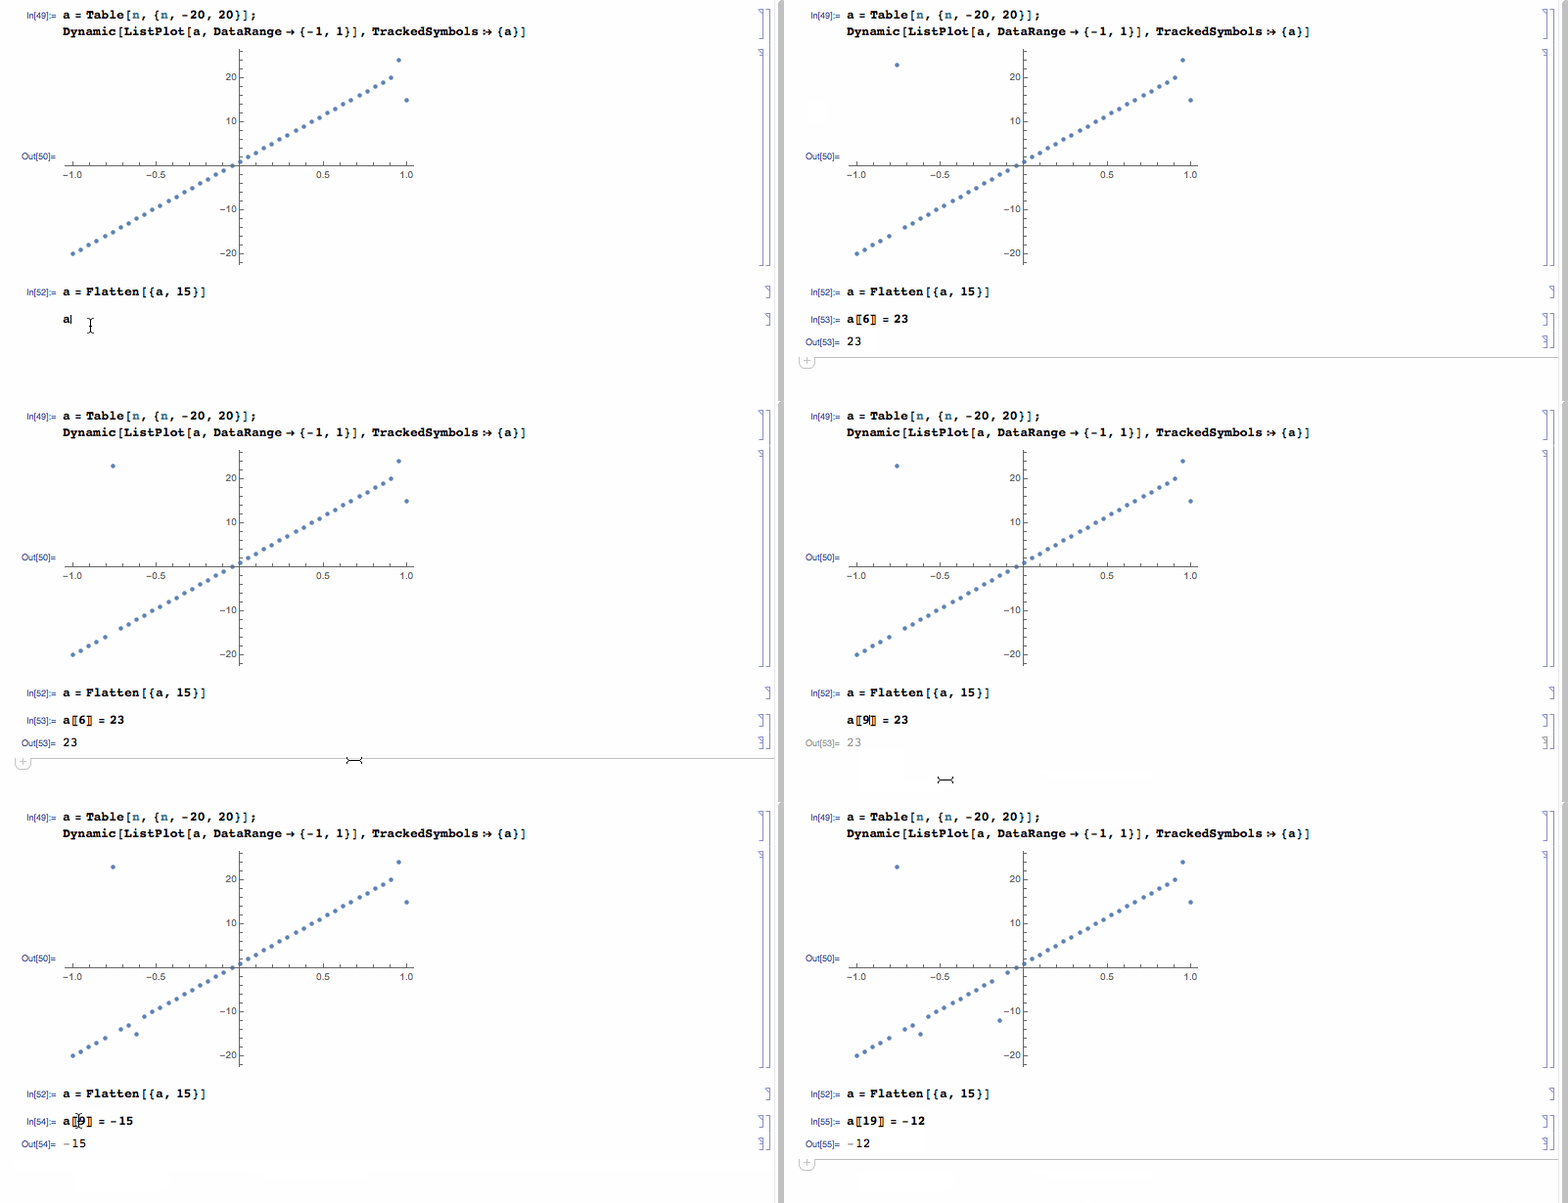
If you wanted to only ever have one plot the two ways come to mind. One is similar to @bbgodfrey's method but incorporating some front end code to delete the previous plot. The other is to make the plot dynamic:
a = Table[n, {n, -20, 20}];
Dynamic[ListPlot[a, DataRange -> {-1, 1}], TrackedSymbols :> {a}]
Now every time you change a the plot will change. The example below is quick and dirty. I've used Flatten to modify a but there are many other ways: Join, Append, Prepend and so on.
Edit
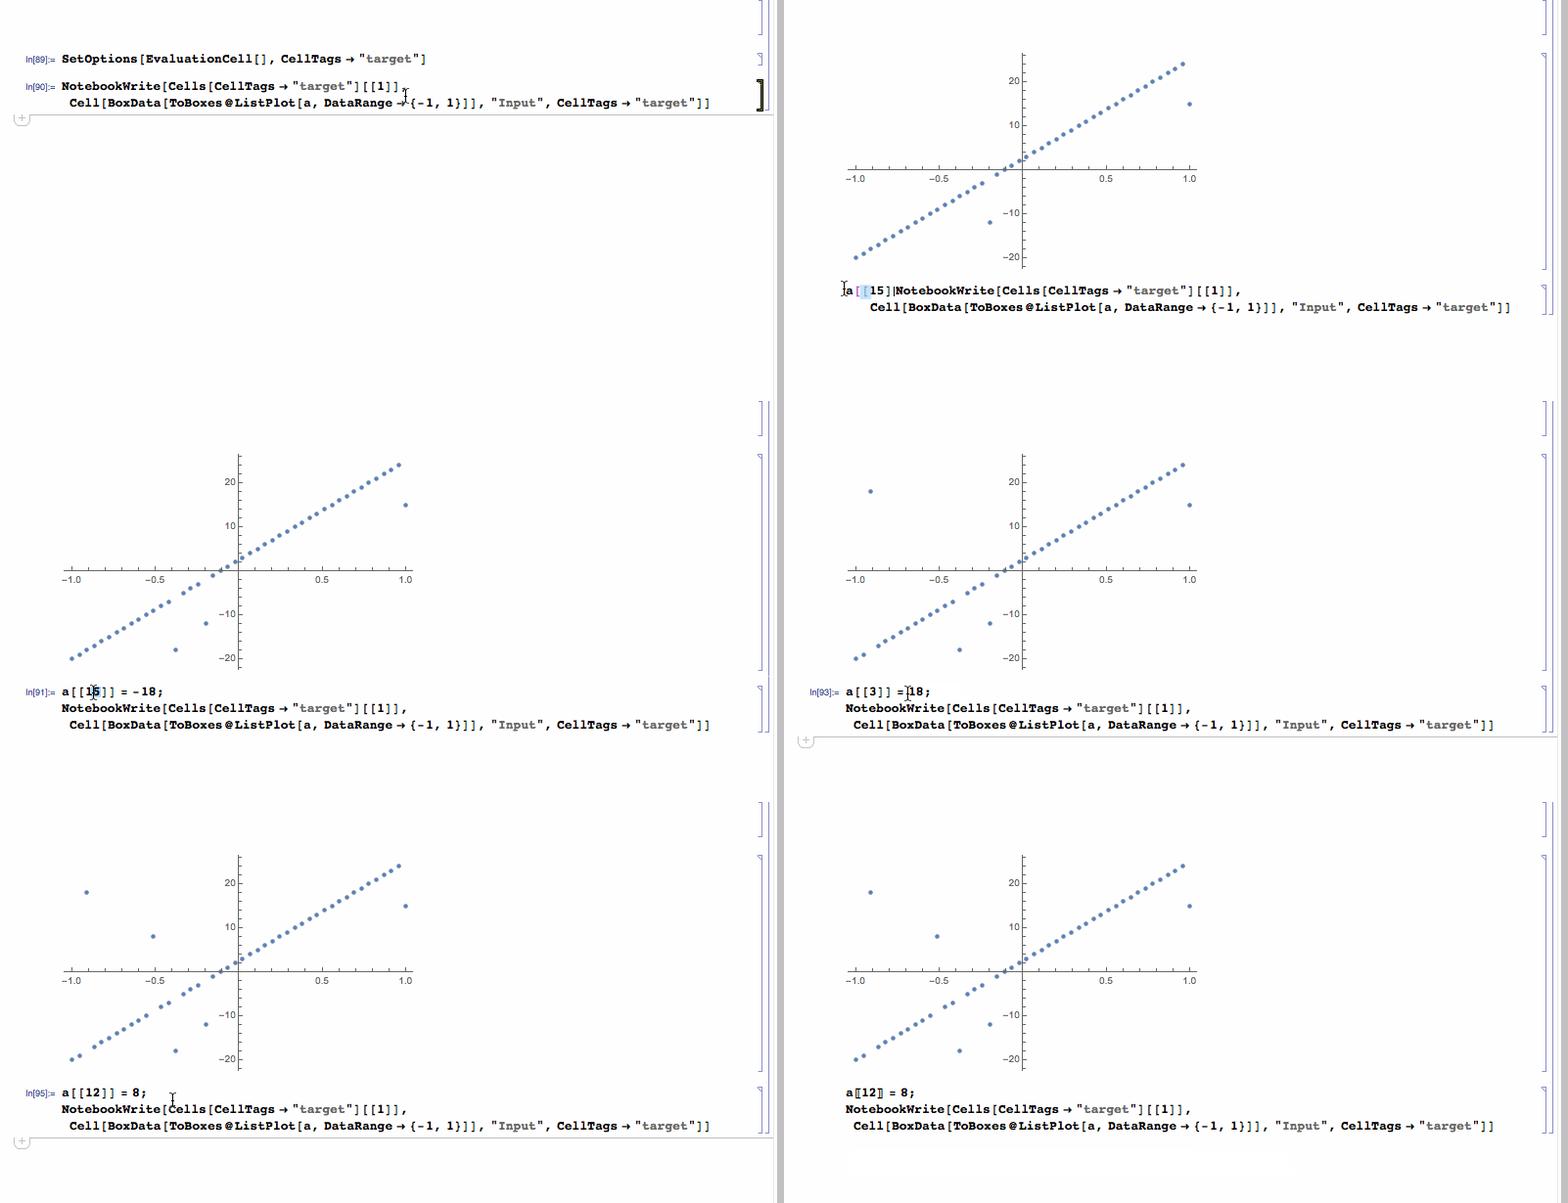
there are a few ways to do it without using dynamic. Here is a reference to something @Kuba posted:
SetOptions[EvaluationCell[], CellTags -> "target"]
then
NotebookWrite[Cells[CellTags -> "target"][[1]],
 Cell[BoxData[ToBoxes@ListPlot[a, DataRange -> {-1, 1}]], "Input",
  CellTags -> "target"]]


