An interesting issue was raised [in comments](https://mathematica.stackexchange.com/questions/174682/monitoring-plot3d-with-a-given-number-of-plotpoints#comment458586_174682) to the following question: [Monitoring Plot3D with a given number of plotpoints](https://mathematica.stackexchange.com/q/174682/27951).
We were discussing the fact that a `Plot3D` expression with options `PlotPoints -> points` and `MaxRecursion -> 0` evaluated the function to be plotted $4 \ \textrm{points}^2$, instead of simply $\textrm{points}^2$ times as I would have expected from the documentation. In fact, the [docs for `PlotPoints`](http://reference.wolfram.com/language/ref/PlotPoints.html) state that, with more than one variable, `PlotPoints -> n` specifies that $n$ initial points should be used in each direction. That, together with the `MaxRecursion -> 0` should stop any attempts at further refinement.
Searching this site, I learned that the **extra evaluations are used to calculate the "vertex normals"** (see [Why does Plot3D appear to traverse the points twice?](https://mathematica.stackexchange.com/q/163624/27951) and Henrik's answer there). This can be turned off using `NormalsFunction -> None`.
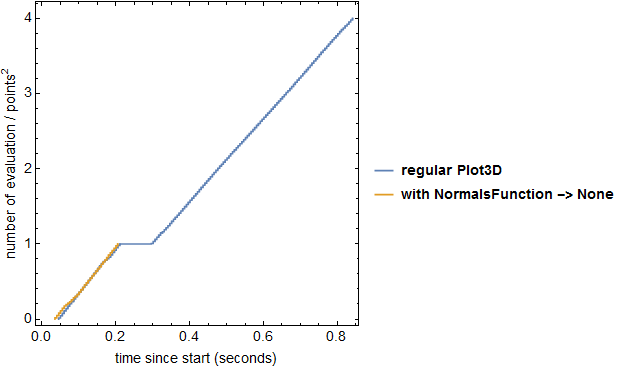
At first, however, I did not know about `NormalsFunction` and its effect, so I was playing around with a toy example, and I noticed a pattern in the function evaluations within `Plot3D` that had me scratching my head. I time-stamped each function evaluation and kept track of how many there were, as a ratio to `points^2`, which was my expected number of evaluations:
points = 100;
timing =
Module[
{i, start, results},
i = 0;
start = TimeObject[Now];
results =
Reap@
Plot3D[
1, {x, -2, 2}, {y, -2, 2},
PlotPoints -> points, MaxRecursion -> 0,
EvaluationMonitor :> Sow[{TimeObject[Now], i++/points^2}]
];
{#1 - start, #2}& @@@ results[[2, 1]]
];
Requesting $100 \times 100 = 10,000$ points is perhaps uncommon, but it is not outside of the realm of possibilities, and it highlights the issue nicely.
I also generated a `timingNoNormals` by adding `NormalsFunction -> None` to the above code, keeping everything else identical. Here are the results, presented graphically:
ListLinePlot[
{timing, timingNoNormals},
Frame -> True, Axes -> False, AspectRatio -> 1, FrameStyle -> Black,
FrameLabel -> {"time since start (seconds)", "number of evaluation / points^2"},
PlotLegends -> {"regular Plot3D", "with NormalsFunction -> None"}
]

Two features here were surprising to me, which lead to my questions:
- I was surprised to find that a good 3/4 of the evaluation time in `Plot3D` seems to be taken up by calculation of the vertex normals. This can use up quite a bit of time for even moderately costly function. **When can we safely turn this "feature" off using** `NormalsFunction -> None`**? Would it be safe to make that option persistent?**
- Additionally, the delay between the first batch of function evaluations and the second, corresponding to that plateau in the blue plot above, was surprising to me. **What is Plot3D doing in between?** Building a `Graphics3D` object?