3
$\begingroup$

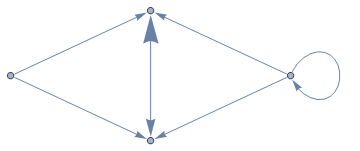
I like the default display of Graph much better than that of GraphPlot, but I do not see how to turn off the use of multi-edges in a directed graph. (That is, if {a,b} and {b,a} are edges, I would like one line between them that has two arrowheads.) Is it possible?

Related: is it not odd that GraphPlot[Graph[...]] produces a different display than Graph[...]? If there is no way to turn off multi-edges in Graph, one might hope to simply GraphPlot[Graph[...],MultiedgeStyle->False] and get the same style except without multi-edges.

$\endgroup$
7
  • $\begingroup$ You could use the SimpleGraph function to get rid of multi-edges before plotting. This will also remove self-loops which may be undesirable ... $\endgroup$
    – Szabolcs
    Commented Sep 30, 2015 at 13:34
  • $\begingroup$ It's a directed graph. I want the self loops. I want a reciprocal relation to be one double-ended arrow instead of two separate arrows. Simple example: how to replace the multi-edge with a since edge (with two arrow heads) for Graph[{a -> a, a -> b, b -> a, c -> c}]. $\endgroup$
    – Alan
    Commented Sep 30, 2015 at 14:24
  • 1
    $\begingroup$ "I want a reciprocal relation to be one double-ended arrow instead of two separate arrows." <- That's not exactly the same thing that you described in the question. Can you update your post? $\endgroup$
    – Szabolcs
    Commented Sep 30, 2015 at 18:50
  • $\begingroup$ @Szabolcs Done. Actually I left that out because I did not realize Graph produced multi-edges for undirected graphs. I see now that it does. $\endgroup$
    – Alan
    Commented Oct 1, 2015 at 1:36
  • 2
    $\begingroup$ If you're only interested in directed graphs, but not multigraphs, then take a look at the example in the question I asked yesterday. Using "EdgeLayout" -> "StraightLine" might work ... But don't try it for multigraphs. When I did, it hung my kernel for good. $\endgroup$
    – Szabolcs
    Commented Oct 1, 2015 at 7:38

2 Answers 2

2
$\begingroup$

"MultiEdgeDistance"

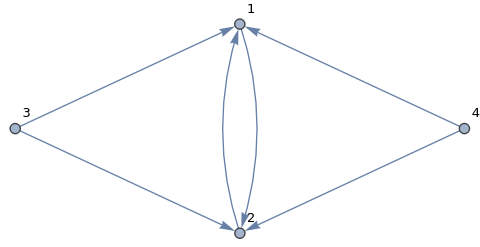
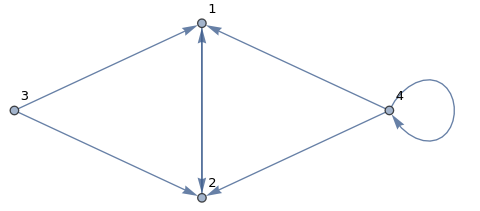
In versions 13.+ (perhaps in earlier versions too) using the option

 GraphLayout -> {"MultiEdgeDistance" -> 0}

gives the desired result:

Graph[{1 -> 2, 2 -> 1, 3 -> 1, 3 -> 2, 4 -> 1, 4 -> 2, 4 -> 4}, 
 VertexLabels -> "Name", 
 GraphLayout -> {"MultiEdgeDistance" -> 0}]

enter image description here

"SelfLoopRadius"

There is also the suboption "SelfLoopRadius" to control rendering of self-loops:

Graph[{1 -> 2, 2 -> 1, 3 -> 1, 3 -> 2, 4 -> 1, 4 -> 2, 4 -> 4}, 
 VertexLabels -> "Name", 
 GraphLayout -> {"SelfLoopRadius" -> 0}]

enter image description here

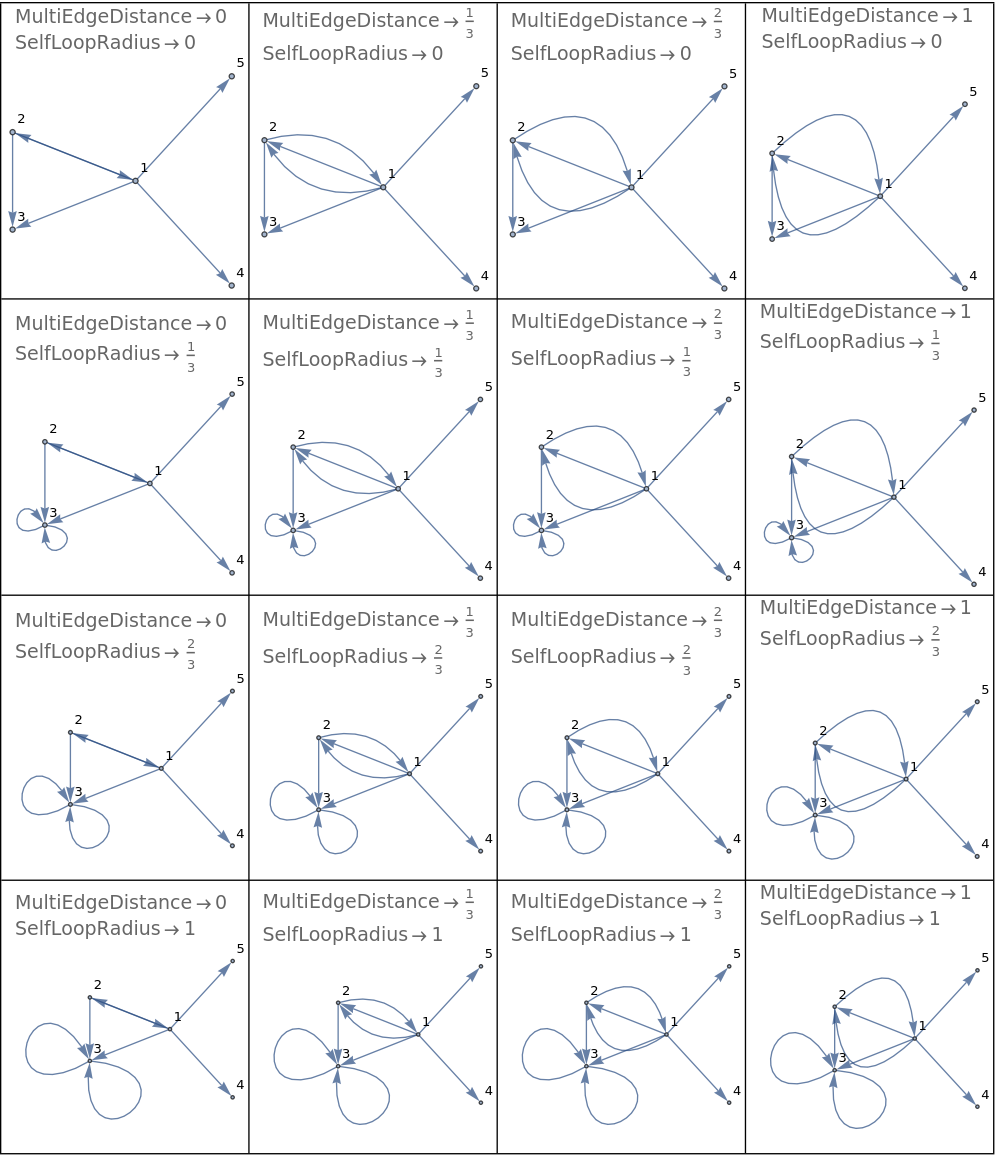
Further examples:

Grid[#, Dividers -> All] & @  Table[
 Graph[{1 -> 2, 1 -> 2, 2 -> 1, 1 -> 3, 1 -> 4, 1 -> 5, 2 -> 3, 3 -> 3, 3 -> 3},
   VertexLabels -> "Name", 
   GraphLayout -> {"MultiEdgeDistance" -> d, "SelfLoopRadius" -> r}, 
   PlotLabel -> 
     Style[Column[{"MultiEdgeDistance" -> d, "SelfLoopRadius" -> r}], 14]], 
 {r, Subdivide[3]}, {d, Subdivide[3]}]

enter image description here

$\endgroup$
2
$\begingroup$

if {a,b} and {b,a} are edges, I would like one line between them that has two arrowheads

ClearAll[modiFy]
modiFy[as_ : {-.05, .05}] := Graph[DeleteDuplicates[EdgeList@#, Sort @ # == Sort @ #2 &], 
 EdgeStyle -> {e : DirectedEdge[a_, b_] /; a =!= b && MemberQ[EdgeList@#, Reverse @ e] :> 
   Arrowheads[as]}, VertexCoordinates -> GraphEmbedding[#], Options @ #]&

Examples:

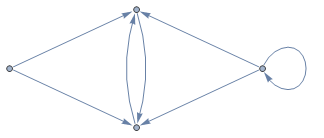
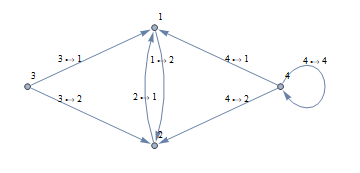
g1 = Graph[{1 -> 2, 2 -> 1, 3 -> 1, 3 -> 2, 4 -> 1, 4 -> 2, 4 -> 4}]

enter image description here

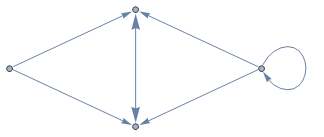
modiFy[] @ g1

enter image description here

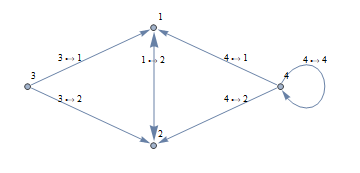
modiFy[{-.08, .05}] @ g1

enter image description here

g2 = Graph[{1 -> 2, 2 -> 1, 3 -> 1, 3 -> 2, 4 -> 1, 4 -> 2, 4 -> 4}, ImageSize -> 400,
  EdgeLabels -> Placed["Name", 1/3], ImagePadding -> 20,  VertexLabels -> "Name"]

enter image description here

modiFy[] @ g2

enter image description here

$\endgroup$

Your Answer

By clicking “Post Your Answer”, you agree to our terms of service and acknowledge you have read our privacy policy.

Not the answer you're looking for? Browse other questions tagged or ask your own question.