4
$\begingroup$

The methods given as answers to this question do not seem to work here. I suspect it is because of my use of Inset function.

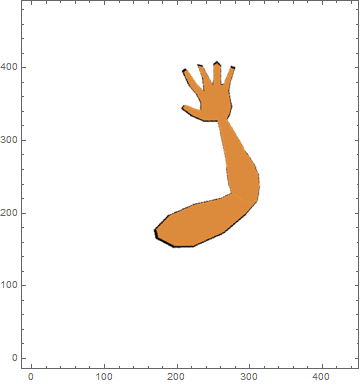
Consider two .png images hand1 and hand2, which can be overlapped to display an arm that can bend at the elbow. Up until now I was displaying the two pictures and moving them around dynamically by changing the display coordinates. The code is the following:

img1 = Import["...\\hand1.png"];
img2 = Import["...\\hand2.png"];
Gimg1[x_, y_] := Gimg1[x, y] = Graphics[Inset[img1, {0, 0}, {200 + x, 141.5 + y}, 400], PlotRange -> {{-200, 200}, {-141.5, 141.5}}, ImageSize -> 400];
Gimg2[x_, y_] := Gimg2[x, y] = Graphics[Inset[img2, {0, 0}, {200 + x, 141.5 + y}, 400], PlotRange -> {{-200, 200}, {-141.5, 141.5}}, ImageSize -> 400];
Dynamic[Show[{Gimg1[x1, y1], Gimg2[x2, y2]}]]
x1 = 0; y1 = 0; x2 = 0; y2 = 0;

where instead of ... I put the proper path to the files. Now, if I change x1,y1,x2,y2 I see the pictures moving around dynamically. To rotate the images, I figured that I would have to wrap them with Rotate[...,θ, {218+x, 222+y}], where {218, 222} are the x-y-coordinates where the elbow appears in the untranslated picture. Therefore, I modify my code as:

img1 = Import["...\\hand1.png"];
img2 = Import["...\\hand2.png"];
Gimg1[x_, y_, θ_] := Gimg1[x, y, θ] = Rotate[ Graphics[Inset[img1, {0, 0}, {200 + x, 141.5 + y}, 400], PlotRange -> {{-200, 200}, {-141.5, 141.5}}, ImageSize -> 400],θ, {218+x, 222+y}];
Gimg2[x_, y_, θ_] := Gimg2[x, y, θ] = Rotate[ Graphics[Inset[img2, {0, 0}, {200 + x, 141.5 + y}, 400], PlotRange -> {{-200, 200}, {-141.5, 141.5}}, ImageSize -> 400],θ, {218+x, 222+y}];
Dynamic[Show[{Gimg1[x1, y1, θ1], Gimg2[x2, y2, θ2]}]]
x1 = 0; y1 = 0; x2 = 0; y2 = 0; θ1 = 0; θ2 = 0;

But now, unfortunately, the images do not even appear when using the Show command. I tried moving the wrapper Rotate[...,θ, {218+x, 222+y}] to lower levels, wrapping around the Inset, or even the images themselves. Nothing seems to work here. The question is, how can I rotate overlapped Inset images around a certain pixel coordinate while maintaining the ability to also translate the pictures and display everything dynamically and keeping it in a frame of fixed size?

$\endgroup$

1 Answer 1

4
$\begingroup$

According to the Documentation page for Show,

Show can be used with Graphics and Graphics3D.

So you cannot combine objects with Head Rotate using Show.

When you move Rotate deeper and wrap it around Image, you obtain an error message saying that Rotate expects a Graphics primitive or directive while Image is not a Graphics primitive. A Graphics primitive which corresponds to Image is Raster, so you should convert it via Show[img1][[1]]. You could also use Translate instead of Inset for positioning the rotated image:

Graphics[{Translate[Rotate[Show[img1][[1]], Pi], {-.5, -.5}]}, Frame -> True]

graph

If you wish to rotate in the linear RGB colorspace, you can perform it in the following way (I use functions ‌​sRGB2Linear and linear2sRGB from this answer):

linearRotate[sRGBimg_Image, \[Theta]_, size_: Automatic] := 
  linear2sRGB[ImageRotate[‌​sRGB2Linear[sRGBimg], \[Theta], size]];

Graphics[{Translate[Show[linearRotate[img1, Pi/3]][[1]], {-5, -5}], 
  Translate[Show[linearRotate[img2, Pi/3]][[1]], {-5, -5}]}, Frame -> True]

graph

By default ImageRotate uses Automatic Resampling method which interpolates the pixel values using "the most suitable method". You can specify the resampling method explicitly (please try it in a Notebook for comparison with the default method, images posted here do not represent the actual output exactly):

linearRotate[sRGBimg_Image, \[Theta]_, size_: Automatic] := 
  linear2sRGB[
   ImageRotate[sRGB2Linear[sRGBimg], \[Theta], size, Resampling -> "Constant"]];

Graphics[{Translate[Show[linearRotate[img1, Pi/3]][[1]], {-5, -5}], 
  Translate[Show[linearRotate[img2, Pi/3]][[1]], {-5, -5}]}, Frame -> True]

graph

$\endgroup$
5
  • $\begingroup$ This is very helpful! My only concern is now the color artifact that appears at the edges of the images due to rotation being done in the non-linear color format (what your other post from 2012 is about, where we talked earlier). As mentioned there, the linearized functions seem to misbehave for the above png's (at least when I try it). Any Idea how to fix it? $\endgroup$
    – Kagaratsch
    Commented Sep 13, 2015 at 0:48
  • $\begingroup$ Oh, if I zoom in on the picture rotated in the linear RGB color space, it still seems that there are some color artifacts left at the edges (rims of slightly lighter orange appear). I wonder, is this something generic that cannot be fixed by applying linear RGB color space transformations? $\endgroup$
    – Kagaratsch
    Commented Sep 13, 2015 at 1:01
  • 1
    $\begingroup$ The artifacts are due to Resampling method used by ImageRotate, of course performing rotation in the linear colorspace does not change the Resampling method. You can specify the method explicitly, see updated answer. $\endgroup$ Commented Sep 13, 2015 at 1:15
  • $\begingroup$ Oh, that is great to learn! It seems the Resampling option is present in ImageRotate but not the Rotate function. I prefer to use Rotate since it allows to rotate around a coordinate other than the center. For instance, if I want to leave the upper arm unrotated and only rotate the lower arm around the approximate coordinate of the elbow, it would look like the arm is bending in the elbow. I don't know how one would do this with ImageRotate. Is that possible? $\endgroup$
    – Kagaratsch
    Commented Sep 13, 2015 at 1:26
  • 1
    $\begingroup$ Again, please read the Documentation! Under the "Properties & Relations" section on the page for ImageRotate you find direct answer to your question. Please check the Documentation before posing the questions here! $\endgroup$ Commented Sep 13, 2015 at 1:30

Your Answer

By clicking “Post Your Answer”, you agree to our terms of service and acknowledge you have read our privacy policy.

Not the answer you're looking for? Browse other questions tagged or ask your own question.