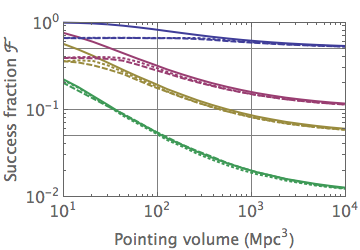
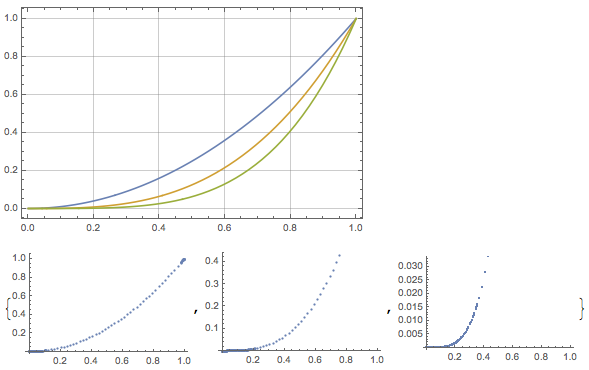
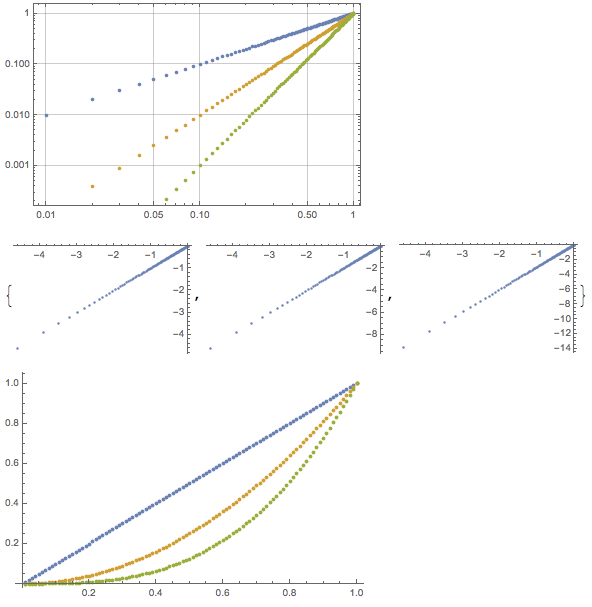
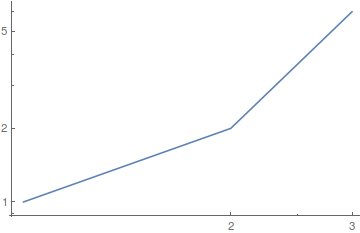
I have some plots in an old Mathematica notebook that I'd like to re-create in Matplotlib (for stylistic consistency with the rest of the plots in my thesis).
Unfortunately, I've lost the data that I used to generate these plots. Since the plots are still intact, is it possible to extract the coordinates of the data points from them? I know that I can use "Get Coordinates" from the context menu on the plot, but this is tedious and imprecise!
They were generated in version 8 or 9, I think. This is the code that I used to generate the plots:
MoneyPlot[dataSets_, Vs_, fs_] :=
  Show @@ {ListLogLogPlot[dataSets[[1, 1]],
      PlotStyle -> dataSets[[1, 2]],
      Joined -> True
      (* Some more options *)
      ]}~Join~
    Table[ListLogLogPlot[data[[1]], PlotStyle -> data[[2]],
      Joined -> True], {data, dataSets[[2 ;;]]}];


Plot,ContourPlot,DensityPlot, etc.) these are, how many traces are shown on each plot, etc. So please post an example! $\endgroup$