3
$\begingroup$

If I am interested in getting a fairly precise plot of f2 below, can I use WorkingPrecision to do this?

f1 = Sin [ x Log [ Prime [ i ] ] ]/( Prime [ i ] );
f2  = Sum [ f1, {i, 1, 50} ];

I did look at some of the questions under WorkingPrecision. None seemed quite on point. If I specify a precision in the code, do I have to do so in the plotting as well (and conversely)?

$\endgroup$
3
  • $\begingroup$ Have you tried plotting what you have already? Can you show the code for that? What is wrong with the plot you obtain currently? $\endgroup$
    – MarcoB
    Commented Sep 10, 2015 at 16:00
  • $\begingroup$ @MarcoB: Yes, I just used Plot[ f2, { } ] with limits. But I doubt I get the benefit of 50 terms if I don't increase precision. What's wrong with it? Nothing, but I would like to identify zeros of the sum with good precision. My experience with 9.0 (home) is that there is often a big diff. in results from precision unspecified to precision specified. $\endgroup$
    – daniel
    Commented Sep 10, 2015 at 17:01
  • $\begingroup$ For the exact expression should the sum be to infinity? $\endgroup$ Commented Sep 10, 2015 at 23:43

1 Answer 1

1
$\begingroup$

If you are interested in obtaining approximations of the zeros of that function, you don't really need to plot it to high precision.

In this case, NSolve is able to give you numerical solutions for specific ranges of $x$, and it can do that at an arbitrary precision that you specify using the WorkingPrecision option:

NSolve[f2 == 0 && 0 <= x <= 15, x, WorkingPrecision -> 30]

(* Out: 
{{x -> 0}, 
 {x -> 3.80400271741859550812071773878}, 
 {x -> 10.3253913711535069593238631633},
 {x -> 14.0297407505371491584516215691}}
*)

A much faster approach uses numerical root-finding methods to find all the zeros of your function in a given interval. A few methods have been proposed on this site to do so using numerical methods; I'll refer you to a recent post by yohbs on this topic.

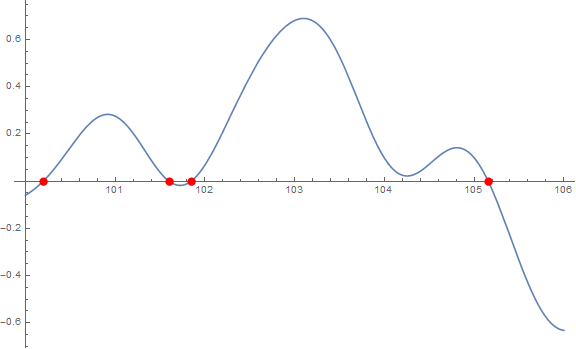
For instance, you could use yohbs's excellent rootSearchD function from his answer in that thread (where you can also find the code for it). rootSearchD needs a pure function to work on, so I generate such a function f from your expression of f1 and f2. I then look for zeros of that function in the interval $[\text{rangemin}, \text{rangemax}]=[100,106]$ setting the desired precision of the results using WorkingPrecision.

f = Sum[Sin[# Log[Prime[i]]]/Prime[i], {i, 1, 50}] &;
rangemin = 100; rangemax = 106;

nsols = rootSearchD[f, rangemin, rangemax, WorkingPrecision -> 35]

Plot[f[x], {x, rangemin, rangemax},
  Epilog -> {Red, PointSize[0.015], Tooltip[Point[{#, 0}], #] & /@ nsols},
  ImageSize -> Large
]

(* Out: {100.19626209644848914285986869397657,
         101.59999375978473413106702727668323,
         101.84542249631610381942296725497735,
         105.15676371559998831763738622073285} *)
Mathematica graphics

$\endgroup$
3
  • $\begingroup$ This is very much what I was looking for, thanks. $\endgroup$
    – daniel
    Commented Sep 11, 2015 at 4:34
  • $\begingroup$ @daniel I'm glad to hear that my answer was helpful. If it satisfies your requirements, you might consider formally accepting it by clicking on the grey check mark next to it. Thank you! $\endgroup$
    – MarcoB
    Commented Sep 14, 2015 at 6:14
  • $\begingroup$ With pleasure. I usually give it 24 hours but got occupied. $\endgroup$
    – daniel
    Commented Sep 14, 2015 at 14:17

Your Answer

By clicking “Post Your Answer”, you agree to our terms of service and acknowledge you have read our privacy policy.

Not the answer you're looking for? Browse other questions tagged or ask your own question.