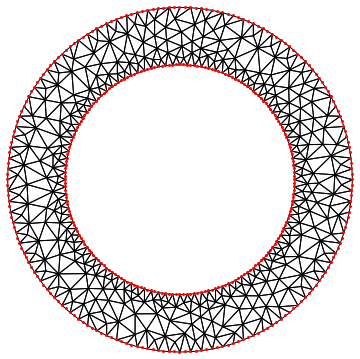
Let b1, b2 map the unit circle to the inner, outer boundaries respectively. You might need to handle a list of points with Map (e.g., b1 /@ bdy) depending on b1 and b2. Then here is a simple way:
Needs["NDSolve`FEM`"]

Clear[b1, b2];
n = 100;
bdy = Table[{Cos[t], Sin[t]}, {t, 0., 2 Pi - 2 Pi/(2 n),
    2 Pi/(2 n)}];
hole = {0., 0.};
b1[pts_?MatrixQ | pts_?VectorQ] := 2 pts;  (* to handle list of points or single pts *)
b2[pts_?MatrixQ | pts_?VectorQ] := 3 pts;
bmesh = ToBoundaryMesh[
   "Coordinates" -> Join[b1@bdy, b2@bdy],
   "BoundaryElements" -> {
     LineElement[Partition[Range[2 n], 3, 2, 1][[All, {1, 3, 2}]]],
     LineElement[
      Partition[Range[2 n + 1, 4 n], 3, 2, 1][[All, {1, 3, 2}]]]
     },
   "RegionHoles" -> b1@hole
   ];
emesh = ToElementMesh[bmesh];

Show[
 emesh["Wireframe"],
 Graphics[{Red, Point[Join[b1@bdy, b2@bdy]]}]
 ]

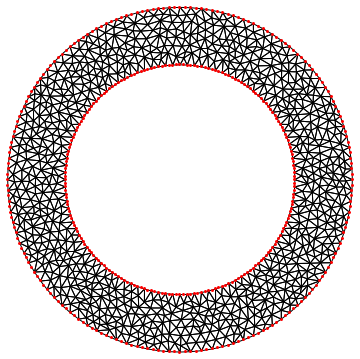
I picked n = 100 to show the limitations of this somewhat naive approach. The interior mesh does not match the fineness of the boundary mesh. You can control it with MaxCellMeasure. However, depending on the setting, it might subdivide the boundary, in which case there is no guarantee (as far as I know) that the boundaries will conform. Here is a setting that seems to leave the boundary elements intact:
emesh = ToElementMesh[bmesh,
   MaxCellMeasure -> {"Length" -> Sqrt[2] 3 2. Pi/n}];
Show[
 emesh["Wireframe"],
 Graphics[{Red, Point[Join[b1@bdy, b2@bdy]]}]
 ]

Maybe that will get you started.
Alternative:
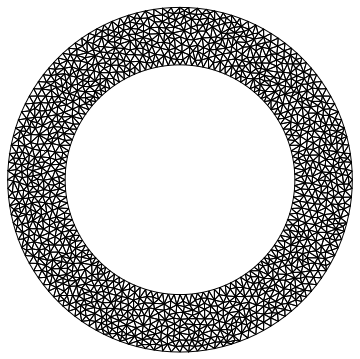
Suppose you have one of the boundaries, and mapping bmap from it to the other boundary, as well as a function hole that identifies the hole in the region. It is better if there is a symbolic description of the region; if there is, then the boundary mesh can be generated accurately. But it the region is from some sort of measurement (such as an image), a discrete representation is fine. Then we can mesh the outer boundary (or whichever is longer) and map the points to the inner boundary. If we mesh the outer boundary with a certain MaxCellMeasure, then the region with the hole is theoretically mesh-able with the same MaxCellMeasure. I can't prove whether it won't result in a modification of the boundary mesh (maybe someone else can comment). It can be checked afterwards though. One can increase the MaxCellMeasure slightly on the second run, to give the mesher some wiggle room.
(* this first part simply constructs the boundary *)
maxCellMu = 0.01;
mesh0 = ToElementMesh[Disk[{0, 0}, 3], MaxCellMeasure -> maxCellMu];
belem = Flatten@ ElementIncidents[mesh0["BoundaryElements"]][[All, All, {1, 3}]];
bpts = mesh0["Coordinates"] ~Part~ belem;
n = Length[bpts]/2;

Clear[bmap, hole];
bmap[pts_?MatrixQ | pts_?VectorQ] := 2/3 pts;
hole[bdy_] := Mean[bdy];    (* works, e.g., for a convex boundary of the hole *)
bmesh = ToBoundaryMesh[
    "Coordinates" -> Join[bpts, bmap@bpts],
    "BoundaryElements" -> {
      LineElement[Partition[Range[2 n], 3, 2, 1][[All, {1, 3, 2}]]],
      LineElement[Partition[Range[2 n + 1, 4 n], 3, 2, 1][[All, {1, 3, 2}]]]
      },
    "RegionHoles" -> hole[bmap@bpts]
    ];
emesh = ToElementMesh[bmesh, MaxCellMeasure -> (*1.05*) maxCellMu];
emesh["Wireframe"]

Issue:
I discovered that, while the vertices (end nodes) of the boundary LineElements are preserved, the mid-side nodes are moved to the midpoints (mean) of the endpoints. This results in a loss of accuracy. I could not discover a method for preserving them, so the solution I propose below is to move them back after the ElementMesh has been generated. Perhaps someone will find a better way.
adjustBoundary[m_ElementMesh, b_] :=
 Module[{incidents, quadpoints, mapping},
  incidents = ElementIncidents[m["BoundaryElements"]];
  quadpoints = m["Coordinates"] ~Part~ Flatten@incidents[[All, All, 3]];
  mapping = AssociationThread[quadpoints -> Flatten[Nearest[b, quadpoints], 1]];
  m /. mapping
  ]

amesh = adjustBoundary[emesh, Join[bpts, bmap@bpts]]
We can visualize the difference. (As explained in FEMDocumentation/tutorial/ElementMeshVisualization, "Wireframe" displays the linear mesh elements as straight lines.)
showmeshpoints[m_, bdy_, opts__?OptionQ] := Show[
  Graphics[{Red, PointSize[Medium], Point@bdy}],
  emesh["Wireframe"],
  Graphics[{Blue, PointSize[Medium], Point[
     m["Coordinates"]~Part~
      Flatten@ElementIncidents[m["BoundaryElements"]]]}],
  opts
  ]

GraphicsRow[
 showmeshpoints[#, Join[bpts, bmap@bpts],
    PlotRange -> {{-0.02, 0.16}, {2.94, 3.01}},
    AspectRatio -> 1] & /@ {emesh, amesh}
 ]

The blue points are the boundary points from the respective mesh (emesh left, amesh right). The red points, when not covered by a blue point, reveal a boundary point that has been moved in the mesh from the original boundary point.


