8
$\begingroup$

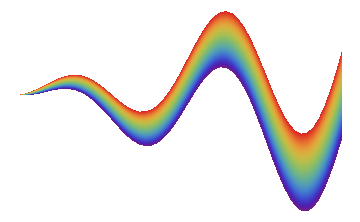
I would like to produce a graphic like thisrainbow
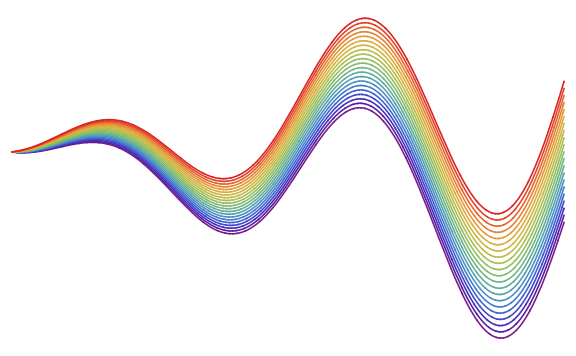
but with a continous color gradient between the outer curves.

Is it possible to achieve this by using the Filling option?

Code for the sake of completeness:

Plot[
   Evaluate@Table[(Sin[x]+o)*x,{o,-0.5,0.5,0.05}],{x,0,4*Pi},
   PlotStyle->Table[ColorData["Rainbow", i/20], {i,0,20}],
   ImageSize->Large,
   Axes->False
]
$\endgroup$
8
  • $\begingroup$ Yes, actually there is an example in the Filling documentation under the Scope -> Filing Style. I would start there. $\endgroup$
    – Szabolcs
    Commented Jul 19, 2015 at 20:52
  • $\begingroup$ @Szabolcs I don't think filling supports gradients in the y direction. For 20 curves as in OP appropriate filling between the curves would give roughly the correct result, but it wouldn't be a truly smooth gradient. $\endgroup$
    – LLlAMnYP
    Commented Jul 19, 2015 at 21:20
  • 1
    $\begingroup$ @LLlAMnYP It does support vertical gradients. The example I cited has one. Here's an example: Plot[{x (Sin[x] - .5), x (Sin[x] + .5)}, {x, 0, 4 Pi}, Filling -> {1 -> {2}}, ColorFunction -> Function[{x, y}, GrayLevel[(y - x (Sin[x] - .5))/x]], ColorFunctionScaling -> False]. But you're right, it won't work for a rainbow colour scheme, even though it does for grayscale. The reason is that it will only use linear interpolation between the two RGB colours on the upper an lower points. This interpolation (done by VertexColors) doesn't care about colour schemes, can't have all rainbow colours. $\endgroup$
    – Szabolcs
    Commented Jul 19, 2015 at 21:26
  • $\begingroup$ @LLlAMnYP The ParametricPlot creates many small polygons in the middle, each of which will interpolates linearly between different sets of colours. So now we can have a full rainbow spectrum. It's also simpler than Filling. +1! $\endgroup$
    – Szabolcs
    Commented Jul 19, 2015 at 21:27
  • $\begingroup$ @Szabolcs my documentation for Filling does not have any similar examples. Is this a new feature in 10.2? $\endgroup$
    – LLlAMnYP
    Commented Jul 19, 2015 at 21:29

1 Answer 1

14
$\begingroup$

Such a filling is possible with ParametricPlot.

ParametricPlot[{x, x (Sin[x] + o)}, {x, 0, 4 Pi}, {o, -0.5, .5}, 
 ColorFunction -> (ColorData["Rainbow"][#4] &), 
 AspectRatio -> 1/GoldenRatio, Frame -> False, Axes -> False, 
 BoundaryStyle -> None]

result

$\endgroup$
1
  • $\begingroup$ updated to match styling in the OP $\endgroup$
    – LLlAMnYP
    Commented Jul 19, 2015 at 21:17

Your Answer

By clicking “Post Your Answer”, you agree to our terms of service and acknowledge you have read our privacy policy.

Not the answer you're looking for? Browse other questions tagged or ask your own question.