20
$\begingroup$

In Mathematica 10, when I plot data that has small changes around some non-zero value, the plot chooses a PlotRange that "collapses" the data so that the variations cannot be seen. The only way I can find to reproduce the results seen in prior versions is to manually set the PlotRange. Is this a bug? Is there a way to redefine the function that computes PlotRange?

Here is a simple example of the problem I have.

dat = {{7.36107564302725094634299*^-8,6.49517319445169858694755},   
       {1.872486493499905555253878*^-7,6.495173287782000920228519}, 
       {3.295280057690389061023151*^-7,6.495173324963207553515714},
       {4.742955045429201620632748*^-7,6.495173299191079237788739}, 
       {5.950099990519129421821797*^-7,6.495173215270764724855183},
       {6.695807917858125246686823*^-7,6.495173088580509534386944}, 
       {6.843647194344045088159516*^-7,6.495172942307050194820725}};

ylim = {Min[#], Max[#]} &[#[[2]] & /@ dat]

ListLinePlot[dat, PlotRange -> All]
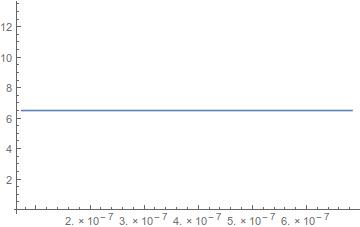
enter image description here

ListLinePlot[dat, PlotRange -> {All, ylim}]
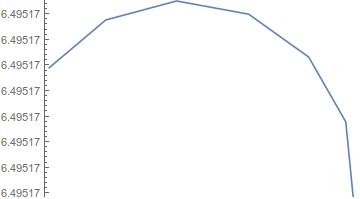
enter image description here

In Mathematica version 9

ListLinePlot[dat, PlotRange -> All]
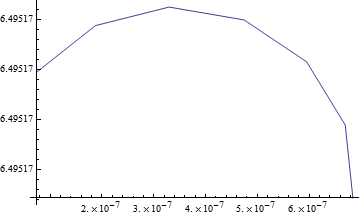
v9

$\endgroup$
1
  • 1
    $\begingroup$ Greg, it seems to me that Mr. Wizard's exhaustive answer below solved your problem. You might consider marking his answer as accepted by clicking the grey check mark next to it. $\endgroup$
    – MarcoB
    Commented Jul 11, 2015 at 3:37

1 Answer 1

18
$\begingroup$

After some spelunking it appears I have an answer and solution: the behavior is as intended, and it is controlled by a Method option "AllowMicroRanges".

ListLinePlot[dat,
  PlotRange -> Full,  
  Method -> {"AllowMicroRanges" -> #}
] & /@ {True, False}

enter image description here

It seems this option may also be given directly, outside of Method, but if you wish to control the default for this option without setting an overall Method you must set it for System`ProtoPlotDump`iListPlot or you get a "... is not a known option for ListLinePlot" message.

SetOptions[System`ProtoPlotDump`iListPlot, "AllowMicroRanges" -> True]
$\endgroup$
6
  • $\begingroup$ The Plot documentation has no Method section. Is there a list of available Method options somewhere (on this side or at wolfram.com)? Or is spelunking the only way to find them? $\endgroup$
    – Karsten7
    Commented Jul 9, 2015 at 0:06
  • 2
    $\begingroup$ @Karsten The documentation shows that Method is one of the options of Plot and ListPlot but ends there as far as I know. It seems that often Method is not documented; I suspect it is primarily (intended to be) used by support to solve specific issues. Spelunking iListPlot reveals this explicit list of methods: {"ScalingFunctions", "MappingFunctions", "DomainMappingFunctions", "AxisPadding", "DomainPadding", "RangePadding", "PointSizeFunction", "AllowMicroRanges", "OptimizePlotMarkers", "DefaultMeshStyle"}. $\endgroup$
    – Mr.Wizard
    Commented Jul 9, 2015 at 0:14
  • $\begingroup$ Thanks a lot. Options[System`ProtoPlotDump`iListPlot] makes me see them too. $\endgroup$
    – Karsten7
    Commented Jul 9, 2015 at 0:24
  • 2
    $\begingroup$ @Karsten That gets most of them but it is not necessarily complete. Where possible reading the implementation itself is more reliable. In this case it reveals "MappingFunctions" and "DomainMappingFunctions". $\endgroup$
    – Mr.Wizard
    Commented Jul 9, 2015 at 1:14
  • 1
    $\begingroup$ @mrz I only know either trial and error, or reading the definition of System`ProtoPlotDump`iListPlot itself to see how the options are being used. See (1742) if you choose the latter. $\endgroup$
    – Mr.Wizard
    Commented Jun 2, 2016 at 19:54

Your Answer

By clicking “Post Your Answer”, you agree to our terms of service and acknowledge you have read our privacy policy.

Not the answer you're looking for? Browse other questions tagged or ask your own question.