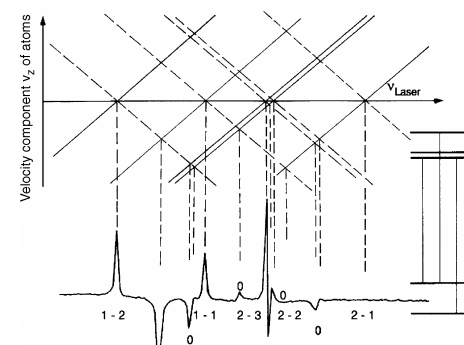
I try to create a special plot where several lines have to be generated automatically between two plots at very precise coordinate. My goal is to make something exactlly like 
But I want to do it for different spectra. If you wonder what does represent this picture, I can tell you that this is about atomic laser spectroscopy (If you have questions I will be glad to give you some answers.)
So, this graph is divided in two parts: the part on the top of the picture is a plot showing several line crossing each other. At each crossing point, a dashed line is drawn towards the second part of the picture, depicting the spectrum. The part on the right has absolutely no importance.
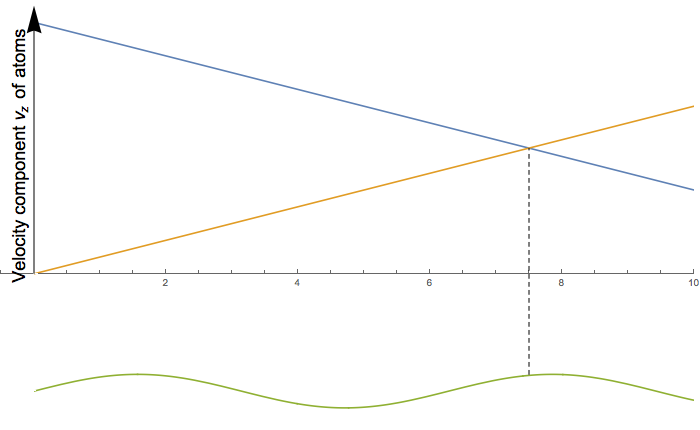
In Mathematica, I can generate each part of the picture separately without problems. I also have the coordinates of every crossing points (one can easily find them by solving the equations of each straight line). I know that it is possible to align verticaly both plots by using GraphicsColumn and ImagePadding.
Now I am searching for the way to generate these dashed vertical lines, knowing the coordinates of each crossing points. Does someone have an idea ?
After that, I would like to automate the method for generating these lines by creating an appropriate function. I guess that the arguments of this function will be the number of crossing points and their coordinates.
Thanks a lot for your coming help
Mimmo


