6
$\begingroup$

I'm looking for a simple way to make the displays of different Graphics expressions accurately reflect their relative sizes.

(By "simple" I mean that it does not require me to calculate explicit ImageSize settings for the various expressions. IOW, I'm looking for something analogous to AspectRatio -> Automatic, which obviates the need to compute the specific values for AspectRatio required to make axes have the same scaling.)

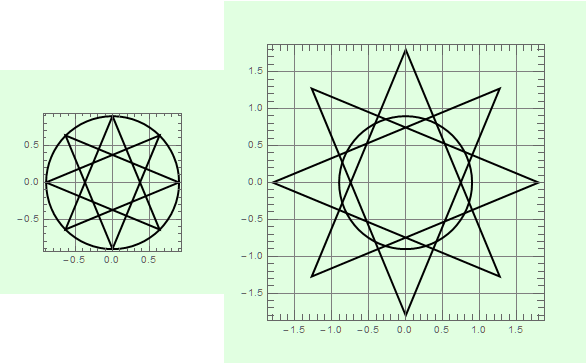
For example, in the Graphics expressions used to generate the display below, the circles have the same radius, but as displayed, the one on the left appears twice as big. Conversely, the star polygons are displayed as having the same size, but the radius specified for the one on the left is half of the radius for the one on the right.

Clear[{star, g}];

star[r_] := 
 Polygon[Table[r {Sin[2 Pi k 3/8], Cos[2 Pi k 3/8]}, {k, 8}]]; 

g[content_] := 
 Graphics[{EdgeForm[{Thick, Black}], Opacity[0], content}, 
  Frame -> True, PlotRangePadding->Scaled[0.1],
  ImagePadding -> 30, ImageMargins -> 15, 
  Background -> LightGreen(*, GridLines -> Automatic*)];

Array[g[{star[0.9 #], Disk[{0, 0}, 0.9]}] &, 2]
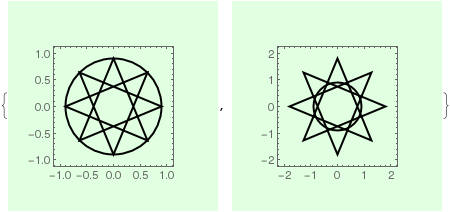
Mathematica graphics

Note that the problem is complicated by the presence of options such as ImagePadding, ImageMargins, and PlotRangePadding.

EDIT: I commented out GridLines -> Automatic in the example above, because the unpredictability of this option's effects makes the problem unnecessarily difficult.

Also, I've added a PlotRangePadding setting to the example above, so that it more closely matches the illustration given further below.

Lastly, although the example above does not require explicitly setting AspectRatio->Automatic, it's safe to assume that I'm dealing with images for which this condition holds, either by default or via an explicit setting.


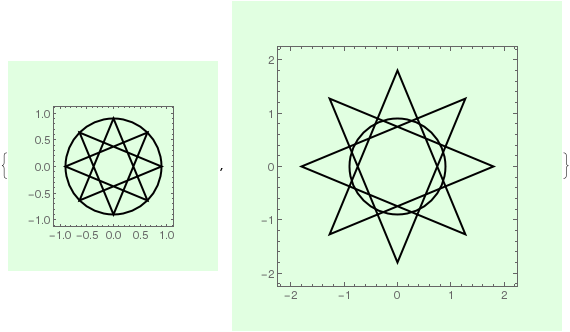
Just to be clear, below I illustrate what I'm looking for. The illustration invokes a hypothetical Scaling option, that one could use to specify the relationship between displayed pixels and "Graphics-space coordinates". E.g. Scaling -> 48 means "48 pixels per unit in 'Graphics-space'".

{
 Graphics[{EdgeForm[{Thick, Black}], 
   Opacity[0], {star[0.9], Disk[{0, 0}, 0.9]}}, Frame -> True, 
  Background -> LightGreen, PlotRangePadding -> Scaled[0.1], 
  ImagePadding -> 30, ImageMargins -> 15, Scaling -> 48],
 Graphics[{EdgeForm[{Thick, Black}], 
   Opacity[0], {star[2 0.9], Disk[{0, 0}, 0.9]}}, Frame -> True, 
  Background -> LightGreen, PlotRangePadding -> Scaled[0.1], 
  ImagePadding -> 30, ImageMargins -> 15, Scaling -> 48]
 }
Mathematica graphics

Of course, AFAIK, there's no Scaling option. I got the output above by painstakingly calculating the settings for ImageSize that would produce the right output. This case is particularly easy (very symmetrical images,Scaled units for PlotRangePadding, etc.), but in general it is a bear to compute these ImageSize values reliably. I'm hoping to find a way to get Mathematica to do this job, and if there isn't one, then at least find a custom solution that does it reasonably reliably.

$\endgroup$
1
  • 1
    $\begingroup$ This answer shows how to obtain the plot range in printer's points. $\endgroup$ Commented Jun 28, 2015 at 4:58

3 Answers 3

4
$\begingroup$

Your problem arises from another Graphics option,PlotRange, having the default value Automatic, which gives each Graphics object its own plot range. To get what you want you will need to force each Graphics object to have the same plot range. Here is something that works for your example. I have made it a little more general than needed because I think you might need the added generality in your actual situation.

star[r_] := Polygon[Table[r {Sin[2 Pi k 3/8], Cos[2 Pi k 3/8]}, {k, 8}]]

g[content_, {px_, py_}] := 
  Graphics[
    {EdgeForm[{Thick, Black}], Opacity[0], content},
    PlotRange -> {{-px, px}, {-py, py}},
    Frame -> True,
    ImagePadding -> 30,
    ImageMargins -> 15,
    ImageSize -> Small,
    Background -> LightGreen,
    GridLines -> Automatic]

Row @ Array[g[{star[0.9 #], Disk[{0, 0}, 0.9]}, {-2, 2}] &, 2]

stars

$\endgroup$
1
  • $\begingroup$ Thanks. I have edited my post to specify more precisely what I'm after. $\endgroup$
    – kjo
    Commented Jun 27, 2015 at 22:35
2
$\begingroup$

The issue, as I understand it, is to display a graphic with its ImageSize proportional to its "real" size. So, in an ideal world one would use something like

plt=Graphics[ ... ];
plt=Show[plt, ImageSize -> AbsoluteOptions[plt, RealSize][[1,2]]/scalefactor]

The problems are, there may be no Option equivalent to RealSize and, if there is, AbsoluteOptions might well return Automatic.

As an alternative, the following works for plots similar to that in Question.

g[content_, isiz_, ipad_] := 
   Graphics[{EdgeForm[{Thick, Black}], Opacity[0], content}, Frame -> True, 
      ImagePadding -> Scaled[ipad], ImageMargins -> 15, Background -> LightGreen, 
      GridLines -> Automatic, ImageSize -> Scaled[2 ipad + isiz/6]]; 
Row@Array[g[{star[0.9 #], Disk[{0, 0}, 0.9]}, 0.9 #, .03] &, 2]

enter image description here

$\endgroup$
2
$\begingroup$

Looks like the undocumented form ImageSize -> a -> b (which makes a user units correspond to b printer's points) does exactly what you want from your Scaling.

You can use it simply as ImageSize -> 1 -> 48 in any function that accepts the option ImageSize.

Alternatively, you can use it to define your custom option ($Scaling) and use as $Scaling -> 48.

ClearAll[$Scaling]
$Scaling /: Rule[$Scaling, s_] := ImageSize -> 1 -> s

Example:

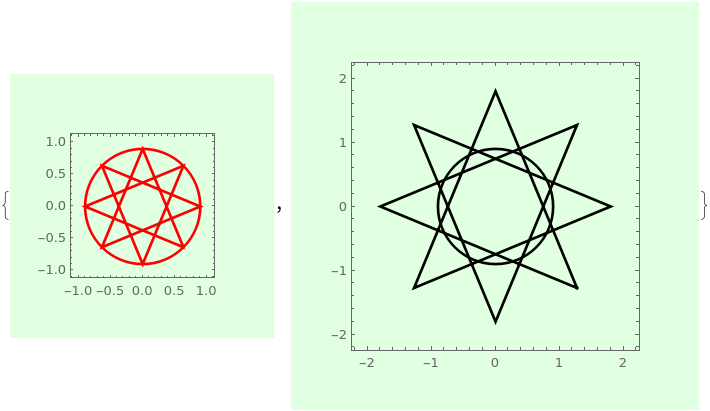
{g1, g2} =
 {Graphics[{EdgeForm[{Thick, Red}], 
   Opacity[0], {star[0.9], Disk[{0, 0}, 0.9]}}, Frame -> True, 
   Background -> LightGreen, PlotRangePadding -> Scaled[0.1], 
   ImagePadding -> 30, ImageMargins -> 15, $Scaling -> 48], 
  Graphics[{EdgeForm[{Thick, Black}], 
   Opacity[0], {star[2 0.9], Disk[{0, 0}, 0.9]}}, Frame -> True, 
   Background -> LightGreen, PlotRangePadding -> Scaled[0.1], 
   ImagePadding -> 30, ImageMargins -> 15, $Scaling -> 48]}

enter image description here

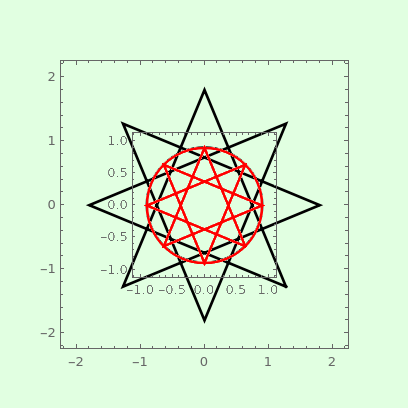
Overlay[{g2, RemoveBackground[g1, {"Background", LightGreen}]}, 
 Alignment -> Center]

enter image description here

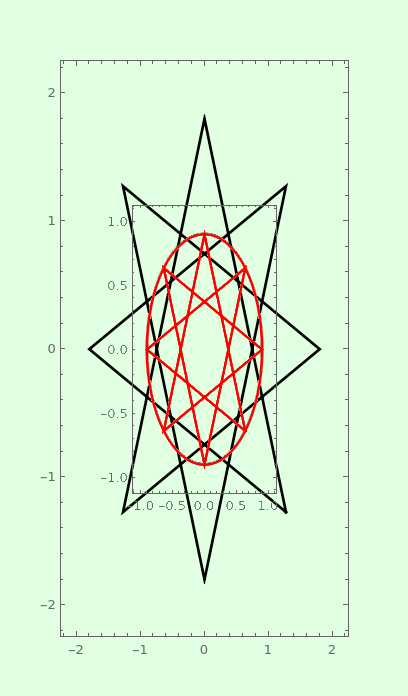
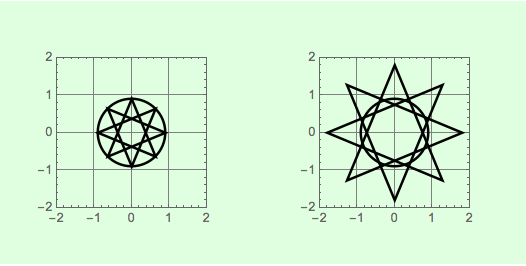
Replace $Scaling -> 48 with $Scaling -> {48, 96} to get

enter image description here

See also:

  1. Exporting image and scale
  2. Maintaining shape size while rotating in GraphicsGrid
  3. Graphics - nice variant of ImageSize (pixels per GraphicsUnitLength)
$\endgroup$
1
  • $\begingroup$ A (+1) just for showing the way to another undocumented functionality. Loved it!!! $\endgroup$
    – bmf
    Commented Jun 6, 2023 at 3:42

Your Answer

By clicking “Post Your Answer”, you agree to our terms of service and acknowledge you have read our privacy policy.

Not the answer you're looking for? Browse other questions tagged or ask your own question.