5
$\begingroup$

I usually export graphics from Mathematica as PDFs which I tweak with Adobe Illustrator. When most plots are exported from Mathematica as PDFs they contain a large number of mostly useless clipping masks.

See:

Plot[Sin[x], {x, -Pi, Pi}]
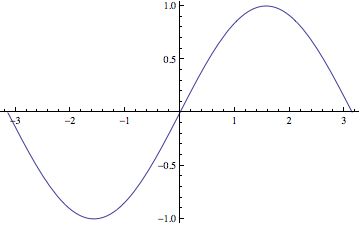
Mathematica graphic

https://dl.dropbox.com/u/3730003/pi.pdf

All the clipping masks can be removed from this PDF with no effect on the look of the plot.

Is there a way to have the PDF exported without clipping masks or somehow remove them automatically after export, ideally with Mathematica?

Note: in some cases (see below) the clipping masks are needed but I don't need a smart solution, if I can get it of all the clipping masks, useless and useful thats fine.

Plot[Sin[x], {x, -2 Pi, 2 Pi}, PlotRange -> {{-Pi, Pi}, All}]
$\endgroup$
11
  • $\begingroup$ Do you see the masks when opening the doc with other programs? $\endgroup$ Commented Jul 23, 2012 at 19:16
  • $\begingroup$ @belisarius It's a feature of the PDFs, it should be visible in any decent vector editor that supports PDF. $\endgroup$
    – Szabolcs
    Commented Jul 23, 2012 at 19:23
  • $\begingroup$ I would try re-processing the PDFs with various programs (xpdf? ghostscript?) and see if that reomoves the masks. I know the problem well, but I haven't tried to come up with an automated solution yet. $\endgroup$
    – Szabolcs
    Commented Jul 23, 2012 at 19:24
  • $\begingroup$ @Szabolcs define "decent" :) $\endgroup$ Commented Jul 23, 2012 at 19:38
  • $\begingroup$ Once upon a time I fixed some EPS bounding box issues by stringbased postprocessing of Mathematica output. Are the masks easily identified in a PDF? $\endgroup$
    – Yves Klett
    Commented Jul 23, 2012 at 19:56

1 Answer 1

3
$\begingroup$

If you are willing to export to eps first and then convert to pdf, try if this works for you. I think it does for me. It is a pretty dirty hack though, so there might be side effects I haven't noticed.

p=Plot[Sin[x], {x, -Pi, Pi}];
Export["plot.eps",StringReplace[ExportString[p,"EPS"],"clip np"->""],"String"]

Also, it might not work for all plots.

Edit

Actually there is a pretty obvious side effect in form of a colored border around the actual curve. I think with a little more tinkering one might be able to get rid of that too.

Edit 2

Alexey Popkov pointed out that it's better to export as "String" than as "Text". I haven't tested it, I just trust him here.

$\endgroup$
1
  • $\begingroup$ It is more correct to Export as "String" the output of ExportString, because exporting as "Text" potentially can damage the output. $\endgroup$ Commented Oct 1, 2017 at 11:17

Your Answer

By clicking “Post Your Answer”, you agree to our terms of service and acknowledge you have read our privacy policy.

Not the answer you're looking for? Browse other questions tagged or ask your own question.