3
$\begingroup$

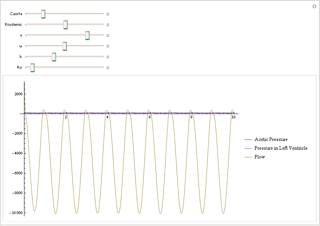
So I am having an issue using NDSolve and plotting the function. So I have two different NDSolve calls in my plotting function. (They are technically the same, just have different names; but that can be changed back if at all possible because I want them to be the same.) But the second one is not working.

When I remove the plotting code from the Manipulate command, Plot works fine and outputs an answer. I just need the expanded form so that I can manipulate the variables (if there is a way around this, that would be great too!)

Here is what I have so far, any help would be appreciated as I have no idea why I am getting this error.

Manipulate[
 Plot[{
   (Evaluate[
     ReplaceAll[
      Paorta[t],
      NDSolve[
       {Paorta'[t] == 
         1/Caorta ((1/2*k*(1 + Cos[ω t]) + 10 - Paorta[t])/
            Piecewise[{{Ro, 
               1/2*k*(1 + Cos[ω t]) + 10 - Paorta[t] > 0}}, 
             x*Ro] - Paorta[t]/Rsystemic), Paorta[0] == 90},
       {Paorta[t]},
       {t, 0, 10}
       ]
      ]
     ]), (1/2*k*(1 + Cos[ω t]) + 
     10), (((1/2*k*(1 + Cos[ω t]) + 10) - 
      Evaluate[
       ReplaceAll[Pao[t], 
        NDSolve[{Pao'[t] == 
           1/Caorta ((1/2*k*(1 + Cos[ω t]) + 10 - Pao[t])/
              Piecewise[{{Ro, 
                 1/2*k*(1 + Cos[ω t]) + 10 - Pao[t] > 0}}, 
               x*Ro] - Pao[t]/Rsystemic), Pao[0] == 90}, {Pao[t]}, {t,
           0, 10}
         ]
        ]
       ])/Ro)},
  {t, 0, 10},
  ImageSize -> Large,
  PlotRange -> Full,
  PlotLegends -> {"Aortic Pressure", "Pressure in Left Ventricle", 
    "Flow"}
  ],
 {{Caorta, 1/.48}, 1, 6},
 {{Rsystemic, 3.1}, .1, 6},
 {{x, 8000}, 1, 10000},
 {{ω, 2 π}, π, 3 π},
 {{k, 110}, 60, 200},
 {{Ro, .01}, .007, .05}
 ]

Thanks in advance!

$\endgroup$
1
  • $\begingroup$ Related: (47907) $\endgroup$
    – Mr.Wizard
    Commented Jun 17, 2015 at 8:35

3 Answers 3

4
$\begingroup$

EDIT: Pulled definition of f outside of Manipulate to avoid update issue pointed out by @MichaelE2

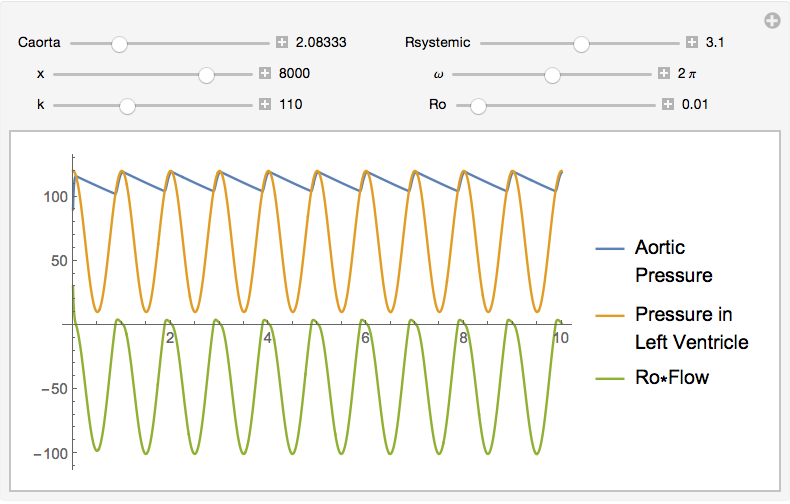
To keep the Flow from dominating the scale of the Plot and making it difficult to see the other two curves, I multiplied the Flow by Ro

f[t_, Caorta_, Rsystemic_, x_, \[Omega]_, k_, Ro_] :=
 Paorta[t] /. NDSolve[
    {Paorta'[t] ==
      1/Caorta ((1/2*k*(1 + Cos[\[Omega] t]) + 10 - Paorta[t])/
          Piecewise[
           {{Ro, 1/2*k*(1 + Cos[\[Omega] t]) + 10 - Paorta[t] > 0}},
           x*Ro] - Paorta[t]/Rsystemic),
     Paorta[0] == 90},
    {Paorta[t]}, {t, 0, 10}][[1]]

Manipulate[
 Plot[
  Evaluate[{f[t, Caorta, Rsystemic, x, \[Omega], k, Ro],
    1/2*k*(1 + Cos[\[Omega] t]) + 10,
    ((1/2*k*(1 + Cos[\[Omega] t]) + 10) -
      f[t, Caorta, Rsystemic, x, \[Omega], k, Ro])}],
  {t, 0, 10},
  ImageSize -> Medium,
  PlotRange -> Full,
  PlotLegends -> {"Aortic\nPressure",
    "Pressure in\nLeft Ventricle", "Ro*Flow"}],
 {{Control[{{Caorta, 1/.48}, 1, 6, Appearance -> "Labeled"}],
    Spacer[25],
    Control[{{Rsystemic, 3.1}, .1, 6, 
      Appearance -> "Labeled"}]}, {Control[{{x, 8000}, 1, 10000, 
      Appearance -> "Labeled"}],
    Spacer[25],
    Control[{{\[Omega], 2 \[Pi]}, \[Pi], 3 \[Pi], 
      Appearance -> "Labeled"}]}, {Control[{{k, 110}, 60, 200, 
      Appearance -> "Labeled"}],
    Spacer[25],
    Control[{{Ro, .01}, .007, .05, Appearance -> "Labeled"}]}} // 
  Grid]

enter image description here

$\endgroup$
6
  • $\begingroup$ @MichaelE2 - On my system it only updates when a control setting is changed. Perhaps you selected AutoRun. $\endgroup$
    – Bob Hanlon
    Commented Jun 16, 2015 at 21:46
  • $\begingroup$ The cell bracket is highlighted constantly. When you set a down-value (f[t_] = ...) it triggers a dynamic update. (V10.1, MacOS, in case it makes a difference. V9.0.1, too.) $\endgroup$
    – Michael E2
    Commented Jun 16, 2015 at 21:47
  • $\begingroup$ I am also using v10.1 on a Mac. I see the cell bracket selected but nothing changes unless I move a slider. $\endgroup$
    – Bob Hanlon
    Commented Jun 16, 2015 at 22:10
  • $\begingroup$ Just to clarify, I'm talking about this: mathematica.stackexchange.com/q/49257 -- Nothing in the displayed plot changes, but it is recomputed every time it finishes (like an infinite loop). The highlighted cell bracket on a Manipulate indicates that the FE is waiting for the kernel to finish computing an update. $\endgroup$
    – Michael E2
    Commented Jun 16, 2015 at 22:14
  • $\begingroup$ @MichaelE2 - edited to avoid this issue. Thanks. $\endgroup$
    – Bob Hanlon
    Commented Jun 16, 2015 at 23:52
4
$\begingroup$

You've got Evaluate in the wrong place. It has to be of the form

Plot[Evaluate[stuff to plot...],...]

So this seems to work:

Manipulate[
 Plot[Evaluate@{
   (ReplaceAll[Paorta[t], 
      NDSolve[{Paorta'[t] == 
         1/Caorta ((1/2*k*(1 + Cos[ω t]) + 10 - Paorta[t])/
             Piecewise[{{Ro, 
                1/2*k*(1 + Cos[ω t]) + 10 - Paorta[t] > 0}}, 
              x*Ro] - Paorta[t]/Rsystemic), 
        Paorta[0] == 90}, {Paorta[t]}, {t, 0, 10}]]),
    (1/2*k*(1 + Cos[ω t]) + 10),
    (((1/2*k*(1 + Cos[ω t]) + 10) - 
        ReplaceAll[Pao[t], 
         NDSolve[{Pao'[t] == 
            1/Caorta ((1/2*k*(1 + Cos[ω t]) + 10 - Pao[t])/
                Piecewise[{{Ro, 1/2*k*(1 + Cos[ω t]) + 10 - Pao[t] > 0}}, 
                 x*Ro] - Pao[t]/Rsystemic), 
           Pao[0] == 90}, {Pao[t]}, {t, 0, 10}]])/Ro)}, {t, 0, 10}, 
  ImageSize -> Large, PlotRange -> Full, 
  PlotLegends -> {"Aortic Pressure", "Pressure in Left Ventricle", "Flow"}],
 {{Caorta, 1/.48}, 1, 6},
 {{Rsystemic, 3.1}, .1, 6},
 {{x, 8000}, 1, 10000},
 {{ω, 2 π}, π, 3 π},
 {{k, 110}, 60, 200},
 {{Ro, .01}, .007, .05}]

Plot has the attribute HoldAll. Evaluate overrides holding an argument exactly when it is the Head of the argument. That's why the placement is important.


Re: Additional request for simplification.

Put the ReplaceAll (/.) outside the list of things to plot. It will, after all, replace all instances of Paorta. :)

Manipulate[Plot[
  Evaluate[
   {Paorta[t],
    (1/2*k*(1 + Cos[ω t]) + 10),
    (((1/2*k*(1 + Cos[ω t]) + 10) - Paorta[t])/Ro)
   } /. NDSolve[{Paorta'[t] == 
       1/Caorta ((1/2*k*(1 + Cos[ω t]) + 10 - Paorta[t])/
           Piecewise[{{Ro, 1/2*k*(1 + Cos[ω t]) + 10 - Paorta[t] > 0}}, 
            x*Ro] - Paorta[t]/Rsystemic), 
      Paorta[0] == 90}, {Paorta[t]}, {t, 0, 10}]
   ],
  {t, 0, 10}, ImageSize -> Large, PlotRange -> Full, 
  PlotLegends -> {"Aortic Pressure", "Pressure in Left Ventricle", "Flow"}],
 {{Caorta, 1/.48}, 1, 6},
 {{Rsystemic, 3.1}, .1, 6},
 {{x, 8000}, 1, 10000},
 {{ω, 2 π}, π, 3 π},
 {{k, 110}, 60, 200},
 {{Ro, .01}, .007, .05}]
$\endgroup$
4
$\begingroup$

Perhaps cleaner

w[k_, ω_, t_] := 1/2*k*(1 + Cos[ω t]) + 10;

pnd = ParametricNDSolve[{
   Paorta'[t] == 1/Caorta ((w[k,ω,t] - Paorta@t)/ 
                 Piecewise[{{ρ, w[k,ω,t] - Paorta@t >0}}, x*ρ]- Paorta@t/Rsystemic), 
   Paorta[0] == 90},
   {Paorta}, {t, 0, 10}, {Caorta, k, ω, ρ, x, Rsystemic}]

Manipulate[
   Plot[
   {#,  w[k,ω,t], (w[k,ω,t] - #)/ρ} &@(Paorta/.pnd)[Caorta, k, ω, ρ, x, Rsystemic][t],
   {t, 0, 10},  Evaluated -> True,  PlotRange -> Full,
   PlotLegends -> {"Aortic Pressure", "Pressure in Left Ventricle", "Flow"}],
 {{Caorta, 1/.48}, 1, 6},
 {{Rsystemic, 3.1}, .1, 6},
 {{x, 8000}, 1, 10000},
 {{ω, 2 π}, π, 3 π},
 {{k, 110}, 60, 200},
 {{ρ, .01}, .007, .05}]

Mathematica graphics

$\endgroup$

Your Answer

By clicking “Post Your Answer”, you agree to our terms of service and acknowledge you have read our privacy policy.

Not the answer you're looking for? Browse other questions tagged or ask your own question.