17
$\begingroup$

I'm plotting gear curves, and I observe that for some parameter values ParametricPlot[] does not plot all the teeth:

gearCurve[a_, b_, n_] := ParametricPlot[
  {
    (a + 1/b Tanh[b Sin[n t]]) Cos[t], 
    (a + 1/b Tanh[b Sin[n t]]) Sin[t]
  }, 
  {t, 0, 2 Pi}, 
  Axes -> False];
  gearCurve[10, 5, 38]

produces the following image:

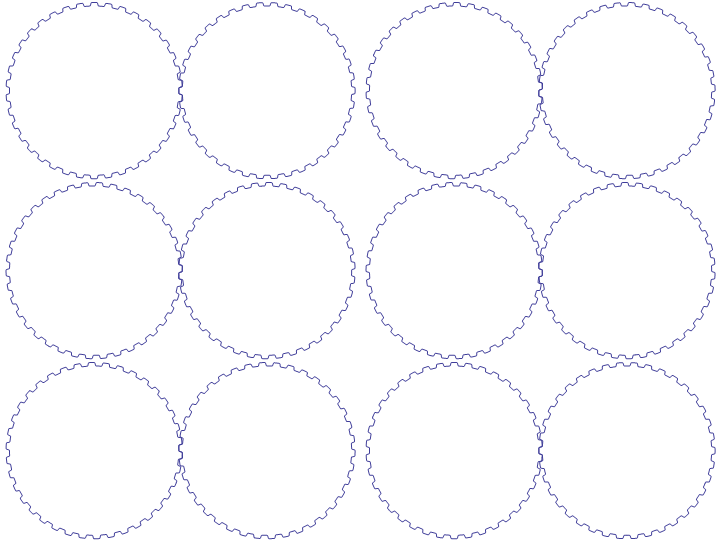
problematic gear

What is going on?

$\endgroup$
0

3 Answers 3

25
$\begingroup$

Yaroslav Bulatov posted a great answer addressing this problem on StackOverflow.

Among several good illustrations the answer includes this undocumented option:

Method -> {Refinement -> {ControlValue -> (*radians*) }}

Alexey Popkov also gave an excellent analysis of the Plot algorithm.

His answer includes the apparently equivalent but cleaner (in degrees rather than radians as above):

Method-> {MaxBend -> (*degrees*) }

Example:

gearCurve[a_, b_, n_] :=
  ParametricPlot[
    {(a + 1/b Tanh[b Sin[n t]]) Cos[t],
     (a + 1/b Tanh[b Sin[n t]]) Sin[t]},
    {t, 0, 2 Pi},
    Axes -> False,
    Method-> {MaxBend -> 1}
  ];

gearCurve[10, 5, 38]

Mathematica graphics

$\endgroup$
5
  • 1
    $\begingroup$ Note: Method -> {Refinement -> {ControlValue -> (*value*) }} was the option known as MaxBend in older versions of Mathematica. $\endgroup$ Commented Jul 19, 2012 at 6:55
  • $\begingroup$ @J.M. any idea why that option is no longer explicitly supported? $\endgroup$
    – Mr.Wizard
    Commented Jul 19, 2012 at 7:04
  • $\begingroup$ I don't, sorry. I'd like to know the answer to that question too... $\endgroup$ Commented Jul 19, 2012 at 7:08
  • 1
    $\begingroup$ @J. M., @Mr.Wizard The MaxBend option is still supported via Method -> {MaxBend -> maxBend} (where maxBend is in Degrees), see the "Edit 4" part here for more information. $\endgroup$ Commented Jul 19, 2012 at 10:47
  • $\begingroup$ @Alexey it's funny but I thought I remembered Yaroslav's answer being longer; I was remembering contents of your answer as being part of it. I'll add that to my answer! $\endgroup$
    – Mr.Wizard
    Commented Jul 19, 2012 at 20:03
16
$\begingroup$

Sorry, the engineer inside couldn't resist

enter image description here

Edit

Here is the code:

gearCurve[a_, b_, n_, c_, h_] := 
  ParametricPlot[{c + (a + 1/b Tanh[b Sin[n t + h]]) Cos[t + h], 
                      (a + 1/b Tanh[b Sin[n t + h]]) Sin[t + h]}, {t, 0, 2 Pi}, 
   Axes -> False, 
   Method -> {Refinement -> {ControlValue -> 1 Degree}}];

Animate[Show[gearCurve[10, 5, 38, 0, h], gearCurve[10, 5, 38, 20, -h],
             PlotRange -> {{-10, 30}, {-10, 10}}], {h, 0, 2 Pi, .01}, 
             DisplayAllSteps -> True]
$\endgroup$
7
  • 1
    $\begingroup$ Okay, now impress me. $\endgroup$
    – Mr.Wizard
    Commented Jul 19, 2012 at 10:26
  • $\begingroup$ @Mr.Wizard The Wankel thing at 2:03 is really beautiful $\endgroup$ Commented Jul 19, 2012 at 10:30
  • $\begingroup$ @Mr. Wizard, epicycloids/hypocycloids take a bit more work to do... :) $\endgroup$ Commented Jul 19, 2012 at 10:52
  • 2
    $\begingroup$ You don't need to animate the whole 360 when you have 38-fold rotational symmetry. $\endgroup$
    – wxffles
    Commented Jul 19, 2012 at 22:19
  • 1
    $\begingroup$ @wxffles In my machine there is something like a small jump when one animation finishes and the next is starting. That is the reason. $\endgroup$ Commented Jul 19, 2012 at 22:28
15
$\begingroup$

Just need to bump up PlotPoints...

gearCurve[a_, b_, n_] := 
  ParametricPlot[{(a + 1/b Tanh[b Sin[n t]]) Cos[
  t], (a + 1/b Tanh[b Sin[n t]]) Sin[t]}, {t, 0, 2 Pi}, 
  Axes -> False, PlotPoints -> 100];
gearCurve[10, 5, 38]

enter image description here

$\endgroup$
1
  • 1
    $\begingroup$ If you want to be able to adjust the PlotPoints or other options at will: gearCurve[a_, b_, n_, opts___] := ParametricPlot[{(a + 1/b Tanh[b Sin[n t]]) Cos[t], (a + 1/b Tanh[b Sin[n t]]) Sin[t]}, {t, 0, 2 Pi}, opts, Axes -> False, PlotPoints -> 100]. Better yet, the code is easily compacted: gearCurve[a_, b_, n_, opts___] := PolarPlot[a + 1/b Tanh[b Sin[n t]], {t, 0, 2 Pi}, opts, Axes -> False, PlotPoints -> 100] $\endgroup$ Commented Jul 19, 2012 at 6:08

Your Answer

By clicking “Post Your Answer”, you agree to our terms of service and acknowledge you have read our privacy policy.

Not the answer you're looking for? Browse other questions tagged or ask your own question.