1
$\begingroup$

I am reading "Dynamics and Bifurcations" by Hale and Kocac, and in chapter one the following diagram is shown:
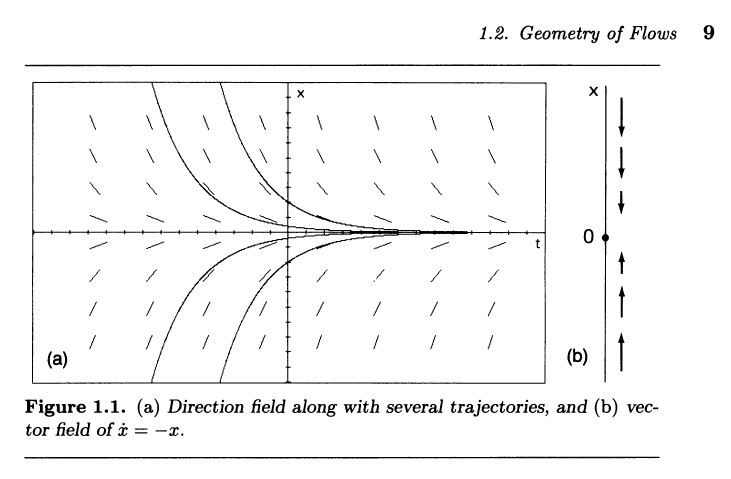
direction field

Question is, how can I achieve the same plot using Mathematica? I've tried StreamPlot, but the plot I get looks somewhat different:

   StreamPlot[{-x, t}, {x, -3, 3}, {t, -3, 3}]
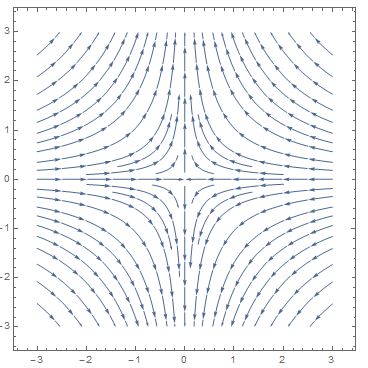
wrong stream plot?

What horrible mistake have I made? Sorry, but I'm fairly new to both ODEs and Mathematica. Thanks for the help.

$\endgroup$

2 Answers 2

2
$\begingroup$

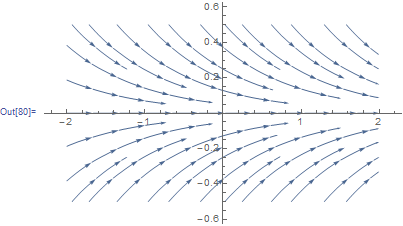
I used the answer here and set the independent variable t as first argument. It looks now close to your book

f[t_, x_] := -x
StreamPlot[{1, f[t, x]}, {t, -2, 2}, {x, -.5, .5}, Frame -> False, 
 Axes -> True, AspectRatio -> 1/GoldenRatio]

Mathematica graphics

$\endgroup$
2
$\begingroup$
sol = DSolve[x'[t] == -x[t], x[t], t];
f = x[t] /. sol[[1]] /. C[1] -> x1;
p1 = ContourPlot[
   Evaluate[Table[x == f, {x1, {-.1, .1, 1, -1}}]], {t, -5, 
    5}, {x, -2, 2}];
points = Join @@ (Table[{i, j}, {i, -5, 5}, {j, -2, 2, .5}]);
line = Rotate[{Gray, Line[{# - {.3, 0}, # + {.3, 0}}]}, 
     ArcTan[-#[[2]]]] & /@ points;
p2 = Graphics[{line, {Red, PointSize[.01], Point[points]}}, 
   Axes -> True, PlotLabel -> "Direction Filed", Frame -> True, 
   PlotRange -> {-3, 3}];
Show[p2, p1]

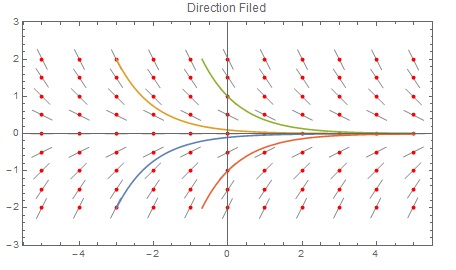
enter image description here

$\endgroup$

Your Answer

By clicking “Post Your Answer”, you agree to our terms of service and acknowledge you have read our privacy policy.

Not the answer you're looking for? Browse other questions tagged or ask your own question.