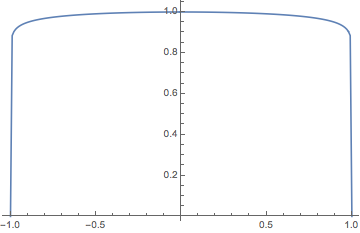
The Mathematica command
Plot[(1 - r^2)^(1/32), {r, -1, 1}]
does not plot the function near the boundary points. That is, the graph does not attain 0 at r = +-1. Increasing WorkingPrecision and PlotPoints does not seem to help. How does one fix the graph to match the function?
$\begingroup$
$\endgroup$
Add a comment
|
1 Answer
$\begingroup$
$\endgroup$
6
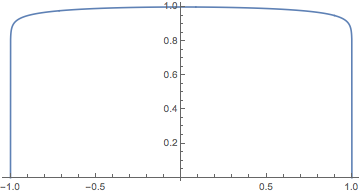
One way is to use ListLinePlot:
ListLinePlot@Table[{r, (1 - r^2)^(1/32)}, {r, -1, 1, 1/100}]

Plot uses open sampling to avoid singularities at endpoints:
Cases[Plot[x^2, {x, 0, 1}], Line[p_] :> First@p, Infinity]
Cases[Plot[1/x, {x, 0, 1}, PlotRange -> All], Line[p_] :> First@p, Infinity]
(* both yield  {{2.04082*10^-8, 4.16493*10^-16}}  *)
Alternative
ParametricPlot does not seem to use open sampling, although it seems to choose a plot range based on the density of plotted points, excluding the two endpoints with default PlotRange:
ParametricPlot[{r, (1 - r^2)^(1/32)}, {r, -1, 1},
 PlotRange -> {{-1, 1}, {0, 1}}, PlotRangePadding -> Scaled[.02]]

-
1$\begingroup$ That's a way out, I agree, but suddenly I find myself wondering, why
Plotoutright refuses to sample the endpoints. $\endgroup$– LLlAMnYPCommented May 13, 2015 at 15:48 -
$\begingroup$ Great solution, great explanation. Thanks! It would be nice to explore LLlAMnYP's train of thought as a collection of these curves is the output. This makes for a larger pdf file. $\endgroup$– dantopaCommented May 13, 2015 at 16:04
-
1$\begingroup$ @dantopa 1) Thanks. It used to be that
Plotsampled the end points and complained bitterly about undefined functions etc. I think user complaints led WRI to change the default behavior to make it easier to plotLog,Tan,1/xetc. 2) See alternative. 3) You might want to wait a day before accepting (thanks, though!) since there may be better answers; not having a accepted answer might encourage others to try out their ideas. $\endgroup$ Commented May 13, 2015 at 16:21 -
$\begingroup$ @Michael E2
ParametricPlotis the ideal solution. (It reinforces your point about waiting for a better solution.) Also, thanks for the introduction toPlotRangePadding. $\endgroup$– dantopaCommented May 13, 2015 at 18:02 -
$\begingroup$ Nice job on six Accepts yesterday. :-) $\endgroup$ Commented May 14, 2015 at 13:42
