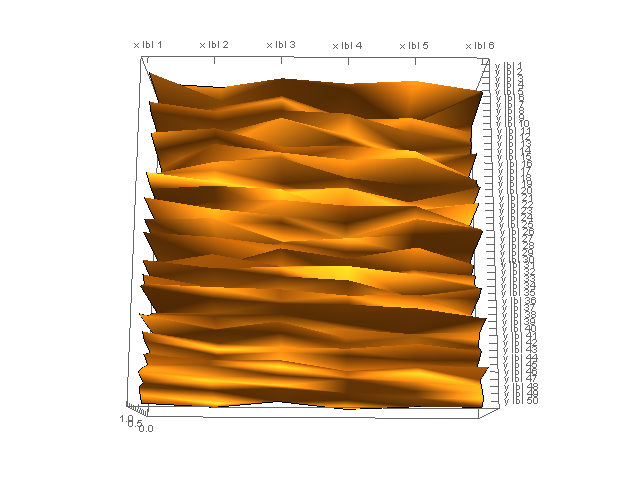
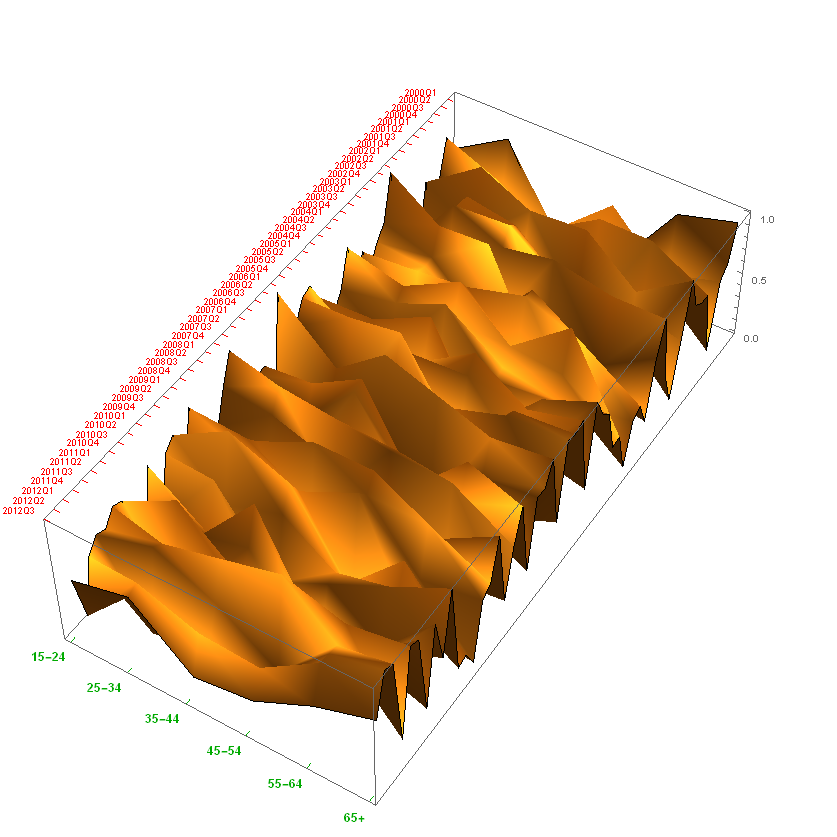
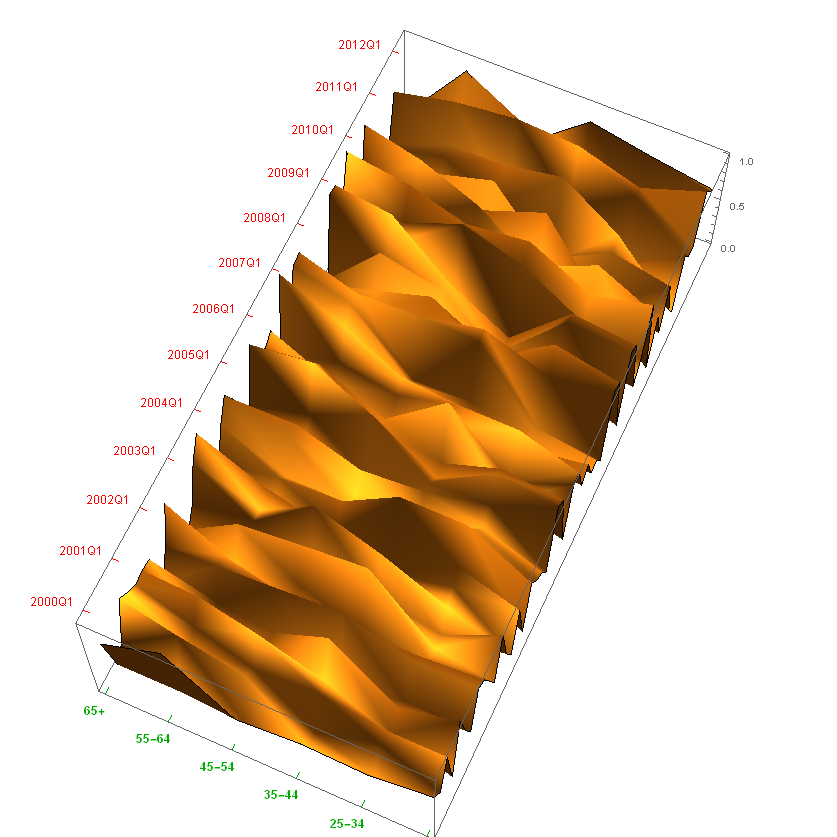
I am trying to use Mathematica to plot a surface chart similar to the ones that are created from Microsoft Excel. The point is to be able to easily colorize and manipulate the plot by free 3D rotation, so to choose the best angle to present the data (ideally fitting it to a function). The data comes from an XLSX file which contains data labels in the first row and the first column, for a 6 by 50 matrix of data points, presented as percentages.
So far I managed to import and plot the data into a notepad by:
data = Import[
   "Activ.xlsx"][[1]]
dims = Dimensions[data]
axisx = Transpose[data][[1]][[2 ;; dims[[1]]]]
axisy = data[[1]][[2 ;; dims[[2]]]]
plotdata = Take[data, -dims[[1]] + 1, -dims[[2]] + 1];
ListPlot3D[plotdata, InterpolationOrder -> 3,
 DataRange -> {{First[axisx], Last[axisx]}, {First[axisy],
    Last[axisy]}, Automatic}, MeshStyle -> Opacity[0.4],
 InterpolationOrder -> 3, ColorFunction -> "Rainbow"]
But when plotting, the Range is invalid and the axis labels (which are categorical, non-numerical) are not shown. I assume that data range in the table needs to be Flattened, Selected or somehow parsed (perhaps with HeaderLines) before plotting it, since when trying ListPlot3D one gets an array error.
Optionally after that, the surface could be ideally fitted to a bivariate function, and both plotted on top of one another with a 50% transparency.
So the basic procedure would be to:
- a) Import data from Excel with column labels for plotting purposes
- b) Convert the data into an array
- c) Perform the 3D plotting
- d) Assign labels
- e) -Optional- Fit data to bivariate function
- f) -Optional- Plot both surfaces (date and fitted function)
Can anyone help in finishing this? Thanks
UPDATE:
It's almost done but not really there: Still getting some wrong labels and overlapping. Also I had to manually edit some labels because for some unknown reason these were not shown (maybe using 'ñ' or because of spacing). Here's the code:
data = Import[
   "C:\\path\\Activ.xlsx"][[1]]
dims = Dimensions[data]
Out[]={6, 54}

axisx = Transpose[data][[1]][[2 ;; dims[[1]]]]
{"    De 16 a 24 años", "    De 25 a 34 años", "    De 35 a 44 años", \
"    De 45 a 54 años", "    De 55 y más años"}

axisy = data[[1]][[2 ;; dims[[2]]]]
Out[]={"2002TI", "2002TII", "2002TIII", "2002TIV", "2003TI", "2003TII", \
"2003TIII", "2003TIV", "2004TI", "2004TII", "2004TIII", "2004TIV", \
"2005TI", "2005TII", "2005TIII", "2005TIV", "2006TI", "2006TII", \
"2006TIII", "2006TIV", "2007TI", "2007TII", "2007TIII", "2007TIV", \
"2008TI", "2008TII", "2008TIII", "2008TIV", "2009TI", "2009TII", \
"2009TIII", "2009TIV", "2010TI", "2010TII", "2010TIII", "2010TIV", \
"2011TI", "2011TII", "2011TIII", "2011TIV", "2012TI", "2012TII", \
"2012TIII", "2012TIV", "2013TI", "2013TII", "2013TIII", "2013TIV", \
"2014TI", "2014TII", "2014T3", "2014T4", "2015T1"}

Flatten@Table[
  ToString@year <> "Q1" <> ToString@quarter, {year, 2002, 2015,
   1}]; firstquarters = Transpose@{Range[1, 4 Length@%, 4], %}

Table[ToString@n <> "-" <> ToString@(n + 9), {n, 15, 45, 10}]~
  Join~{"55+"};
agegroups = Transpose@{Range[Length@%], %}

plotdata = Take[data, -dims[[1]] + 1, -dims[[2]] + 1];
And here comes the (styled) plot:
ListPlot3D[plotdata,
 PlotStyle -> Directive[GrayLevel[0], Opacity[0.75]],
 Mesh -> Automatic, MeshFunctions -> Automatic,
 InterpolationOrder -> Automatic, AspectRatio -> .5,
 ImageSize -> Full, PlotRangePadding -> 0,
 PlotRange -> {Automatic, Automatic, {0, 100}},
 Ticks -> {firstquarters,
   agegroups, {{0, "0%"}, {20, "20%"}, {40, "40%"}, {60, "60%"}, {80,
     "80%"}, {100, "100%"}}, Automatic, Axis -> True,
   FrameTicks -> All, FaceGrids -> All},
 TicksStyle -> {Directive[Smaller], Automatic, Automatic},
 MeshStyle -> Automatic, ColorFunction -> "Rainbow",
 AxesLabel -> {"\nAños 2002-2015", "\nFranja de edad",
   Rotate[Text[Style["Cuantía\n", 14]], \[Pi]/2]},
 Lighting -> {{"Ambient", White}},
 PlotLabel -> Framed@"Actividad laboral (España)"]


DataRangeexpects numerical parameters, but you mentioned that your data labels in your first row and column are categorical. You should look into usingTicksinstead, which allows you to specify the position of tick marks, and a text label for each mark as well. $\endgroup$\[NTilde]. $\endgroup$