10
$\begingroup$

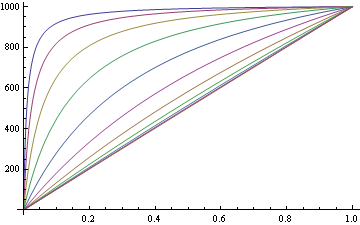
I've got a Plot of a list of functions from this previous question of mine.

rp[x_, r_] := 1000 x (r + 1)/(r + x)
ratios = Table[10^n, {n, -2, 2, 4/10}]
Plot[Map[rp[x, #] &, ratios], {x, 0, 1}, Evaluated -> True]  

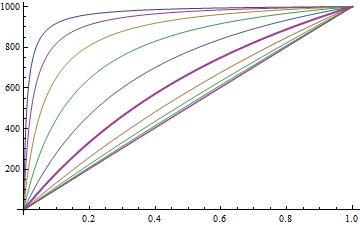
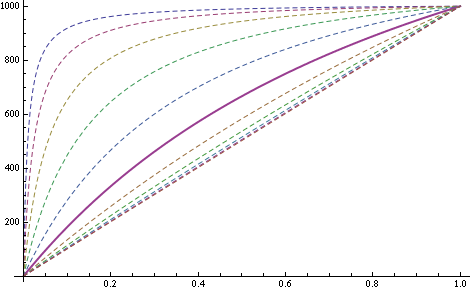
enter image description here

Now I want the sixth function, where ratio = 1, to be plotted with a PlotStyle -> AbsoluteThickness parameter. How can I do this?

$\endgroup$

5 Answers 5

10
$\begingroup$

I prefer using Style in cases like this.

rp[x_, r_] := 1000 x (r + 1)/(r + x)

ratios = Table[10^n, {n, -2, 2, 4/10}];

em = Style[#, AbsoluteThickness[4]] &;

Plot[
 MapAt[em, rp[x, #] & /@ ratios, 6],
 {x, 0, 1},
 Evaluated -> True
]
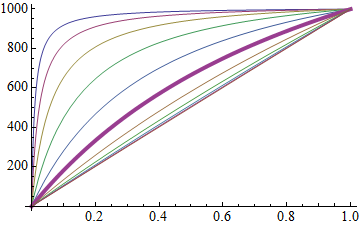
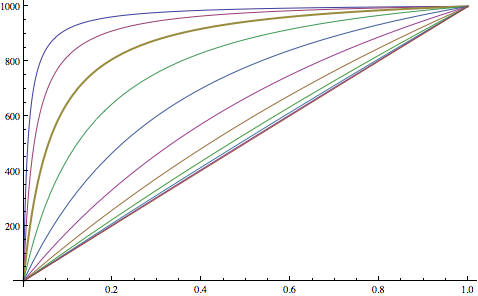
Mathematica graphics

Plot[
 MapAt[em, rp[x, #] & /@ ratios, {{4}, {6}}],
 {x, 0, 1},
 Evaluated -> True
]
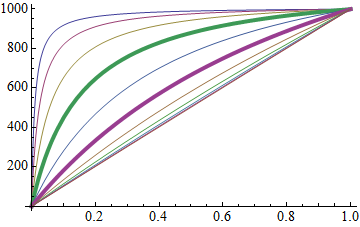
Mathematica graphics


This works for styling directives except for color (by default), but colors are overridden by the default PlotStyle colors because of the output form, which is:

Style[{(* PlotStyle directive *), Line[. . .]}, (* Style directive *)]

If for whatever reason the Style method is desirable for colors as well one could use:

red = Style[#, Red, Thick] &;

Plot[
  MapAt[red, x Range@5, {{2}, {4}}],
  {x, 1, 10},
  Evaluated -> True
] /. Style[{__, L__Line}, s__] :> Style[{L}, s]
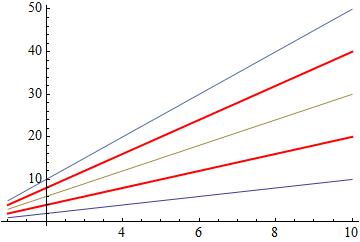
Mathematica graphics

This discards all PlotStyle directives and keeps the Style directives for lines with Style.
$\endgroup$
9
  • 1
    $\begingroup$ Hi Wizard. Nice, compact code. I like it, thanks. +1 for now, later maybe more :-) $\endgroup$
    – stevenvh
    Commented Jul 11, 2012 at 16:08
  • 3
    $\begingroup$ +1, I did not know Plot accepted Style as a function. $\endgroup$
    – rcollyer
    Commented Jul 11, 2012 at 16:57
  • 4
    $\begingroup$ @rcollyer it does, but beware that Plot's own styling overrides this so I use it only for things like Dashed and Thick, not color. $\endgroup$
    – Mr.Wizard
    Commented Jul 11, 2012 at 17:38
  • $\begingroup$ Kudos - is this documented somewhere? $\endgroup$
    – Yves Klett
    Commented Jul 12, 2012 at 6:33
  • 2
    $\begingroup$ @YvesKlett probably so, but after years of trying I'm still not great at finding things in the Documentation system; I have sympathy for the neophytes who post "obvious" questions. $\endgroup$
    – Mr.Wizard
    Commented Jul 12, 2012 at 14:12
10
$\begingroup$

You can generate a list of additional style directives to go with your Plot, e.g. like this

rp[x_, r_] := 1000 x (r + 1)/(r + x)
ratios = Table[10^n, {n, -2, 2, 4/10}];
styles = If[# == 1, Thick, Thin] & /@ ratios;
Plot[Map[rp[x, #] &, ratios], {x, 0, 1}, Evaluated -> True, 
 PlotStyle -> styles]

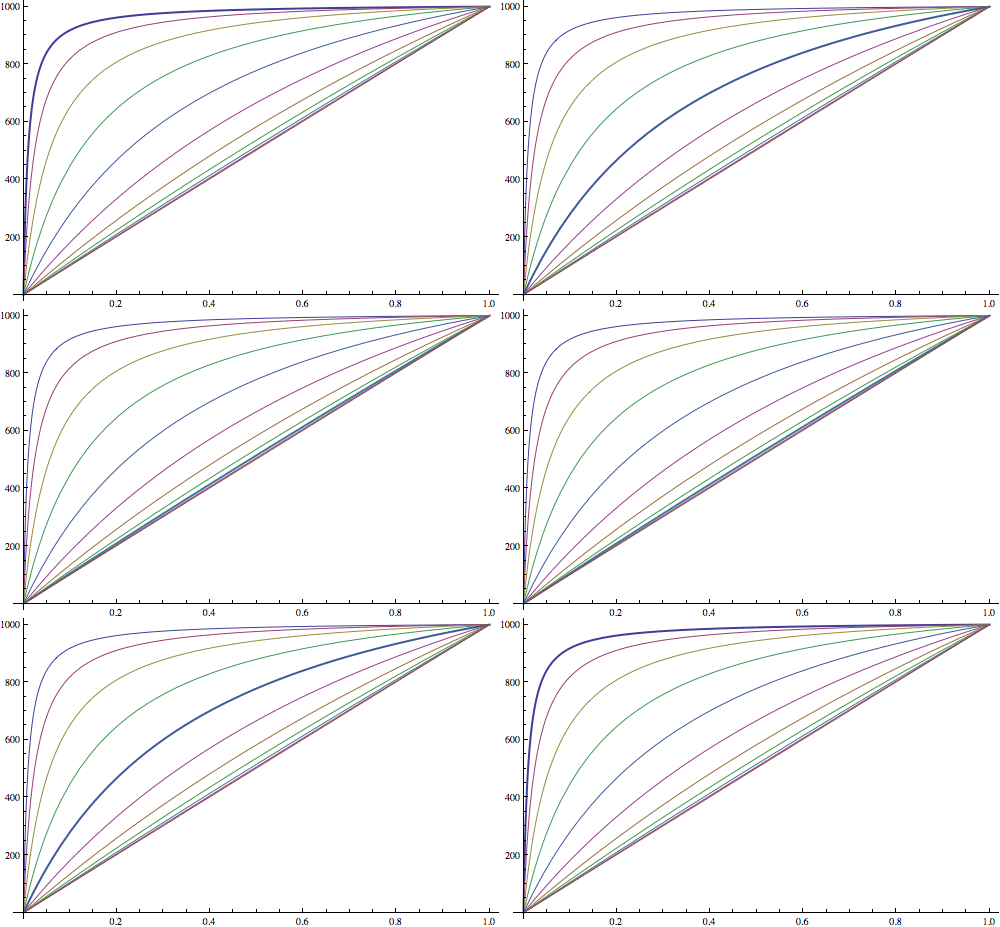
Mathematica graphics

$\endgroup$
5
$\begingroup$
 Plot[Map[rp[x, #] &, ratios], {x, 0, 1}, Evaluated -> True, 
 PlotStyle -> Map[If[#1 == 1, AbsoluteThickness[3], Automatic] &, ratios]]
$\endgroup$
5
$\begingroup$

In addition to Yves' answer, here's a way to modify the $n^\mathrm{th}$ line (corresponding to the $n^\mathrm{th}$ element of ratio) as a post-processing step:

Plot[Map[rp[x, #] &, ratios], {x, 0, 1}, Evaluated -> True]  /. 
    {x___, y : {Hue[__], __} ..} :> {x, MapAt[Insert[#, Thickness[Large], 2] &, {y}, 3]}

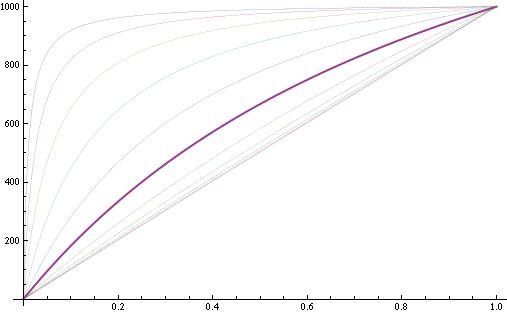
enter image description here

This modifies the 3rd line (given as the third argument of MapAt). As always, structural manipulations are made on the FullForm of the expression, so if you have a more complicated or different structure, you'll have to exploit that accordingly.

Here's the above in a Manipulate to play with:

Manipulate[
    Plot[Map[rp[x, #] &, ratios], {x, 0, 1}, Evaluated -> True] /. 
        {x___, y : {Hue[__], __} ..} :> {x, MapAt[Insert[#, Thickness[Large], 2] &, {y}, i]}, 
    {{i, 1}, 1, Length@ratios, 1}
]

enter image description here

$\endgroup$
7
  • $\begingroup$ ´s nice! A possible (longterm) conflict may arise if the output of Plot changes in the future. Happened to me at some major version switch and resulted in a lengthyish bug hunt ;-) $\endgroup$
    – Yves Klett
    Commented Jul 11, 2012 at 8:13
  • $\begingroup$ Heh yeah, that's why I put in the statutory warning that it is based on the FullForm and different structures will need to be handled differently :) $\endgroup$
    – rm -rf
    Commented Jul 11, 2012 at 8:33
  • $\begingroup$ The severability clause is (and was) duly noted. Just wanted to drive the point home ´cause a thing like this once came back and bit me ;-) $\endgroup$
    – Yves Klett
    Commented Jul 11, 2012 at 8:55
  • $\begingroup$ @YvesKlett it only bit you once? Lucky. I've got code written for 4 major releases, and I pray every time I have to run something from an older version. Of course, some of the prayer is due to the difference in coding ability between then and now, but I digress. :) $\endgroup$
    – rcollyer
    Commented Jul 11, 2012 at 16:56
  • 1
    $\begingroup$ @YvesKlett my wife actually had a computer catch fire while she was using it. $\endgroup$
    – rcollyer
    Commented Jul 12, 2012 at 11:37
3
$\begingroup$

I'm on Linux and using Yves excellent answer I get the following output:

Mathematica graphics

which has a very high contrast between the emphasised line and the rest.

Using a combination of thick and dashed lines seems to my eye to give more pleasing result:

rp[x_, r_] := 1000 x (r + 1)/(r + x)
ratios = Table[10^n, {n, -2, 2, 4/10}];
styles = If[# == 1, Thick, Dashed] & /@ ratios;
Plot[Map[rp[x, #] &, ratios], {x, 0, 1}, Evaluated -> True, 
 PlotStyle -> styles]

Mathematica graphics

$\endgroup$
2
  • 1
    $\begingroup$ This doesn't present a different solution, does it? $\endgroup$
    – stevenvh
    Commented Jul 11, 2012 at 15:55
  • $\begingroup$ @stevenvh Thanks, I forgot to paste the modified code. $\endgroup$ Commented Jul 11, 2012 at 16:05

Your Answer

By clicking “Post Your Answer”, you agree to our terms of service and acknowledge you have read our privacy policy.

Not the answer you're looking for? Browse other questions tagged or ask your own question.