23
$\begingroup$

I'm a newbie who tries to be a good boy, and use Map instead of writing out a list of functions.

I have a table I want to Map onto:

ratios = Table[10^(n/10), {n, 0, 10}]  

and a function

rp[x_, r_] := 1000 x (r + 1)/(r + x)

which I want to Plot for the 11 ratios, for x in [0, 1]:

Plot[Map[rp, ratios], {x, 0, 1}]

This doesn't work, and I can guess why: rp requires two arguments, and MMA probably doesn't know which one is the ratio. And x also doesn't appear as a parameter. How do I fix this?

$\endgroup$
1

4 Answers 4

28
$\begingroup$

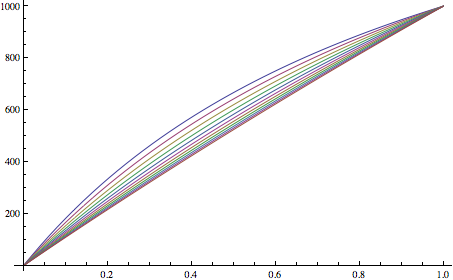
You can create a pure function that maps only on ratio as follows:

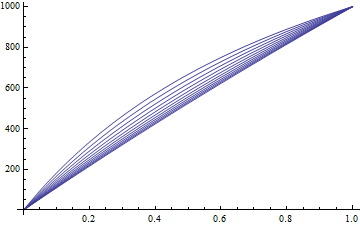
Plot[Map[rp[x, #] &, ratios], {x, 0, 1}, Evaluated -> True]

enter image description here

You will need the Evaluated -> True option in order for Plot to view the functions as several different ones and plot them in different colours.


You can also bypass having to use Map by creating your function with the Listable attribute. For example:

rp2[x_] := Function[{r}, 1000 x (r + 1)/(r + x), Listable]
Plot[rp2[x][ratios], {x, 0, 1}, Evaluated -> True]

This returns the same output as above, but automatically maps (threads) over lists.

$\endgroup$
5
  • $\begingroup$ The Evaluated->True works fine for the PlotStyle option but doesn't work for the PlotLegend option, any clue why? Or has any other trick has to be used? $\endgroup$
    – Öskå
    Commented Jul 22, 2013 at 10:32
  • $\begingroup$ @Öskå Do you have an example? This works: Plot[Table[Sin[k x], {k, 1, 3}], {x, 0, 2 π}, PlotLegends -> Automatic, Evaluated -> True] $\endgroup$
    – rm -rf
    Commented Jul 22, 2013 at 15:02
  • $\begingroup$ Using Mathematica 8 PlotLegend -> {"sine", "sine", "sine"}] only shows "sine" one time: imgur.com/1uyciA9 $\endgroup$
    – Öskå
    Commented Jul 22, 2013 at 15:45
  • $\begingroup$ @Öskå Ugh... that's using the old PlotLegends package, which is hideous. I have no idea how to make it fix and I'm not going to touch that with a 10 ft pole :( Perhaps you might be able to use this answer, which is a far better alternative for Mathematica 8. $\endgroup$
    – rm -rf
    Commented Jul 22, 2013 at 17:12
  • $\begingroup$ mhm thanks :-) I'll take a look at that long answer tomorow. Once again, thanks :-) $\endgroup$
    – Öskå
    Commented Jul 22, 2013 at 17:14
12
$\begingroup$

This is a direct fulfilling of your attempts :

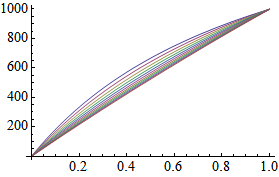
Plot[ rp[x, #] & /@ ratios, {x, 0, 1}]

enter image description here

rp[x, #] & denotes a function depending on the second argument in rp, while /@ is a shorthand for Map, i.e rp[x, #] & /@ ratios means Map[ rp[ x,#] &, ratios ].

Here is another way to plot your functions without Map :

Plot[ Evaluate[ Table[ rp[x, a], {a, ratios}]], {x, 0, 10}]

Evaluate serves here for plotting curves in various colors.

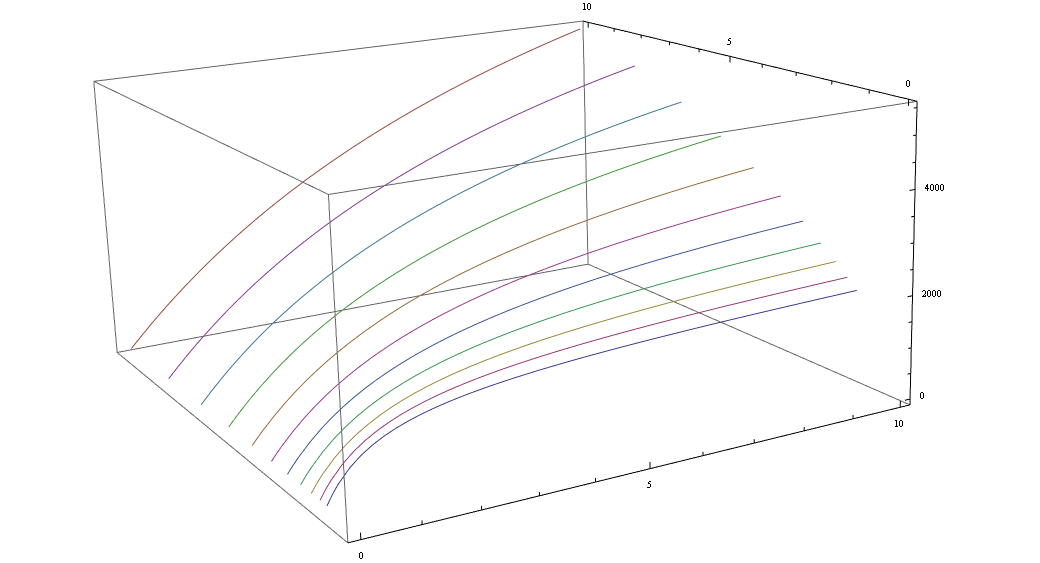
You can plot graphs of the functions as a family of curves in three dimensions using ParametricPlot3D.

ParametricPlot3D[ Evaluate[ Table[{x, a, rp[x, a]}, {a, ratios}]],
                  {x, 0, 10},  BoxRatios -> {10, 10, 5}]

enter image description here

$\endgroup$
4
  • $\begingroup$ @stevenvh You've got another way of doing your task in my answer without Map. $\endgroup$
    – Artes
    Commented Jul 10, 2012 at 15:34
  • $\begingroup$ When using Evaluate in this fashion you need to guard against a global value of x. Add something about this to your answer and you'll have my vote. $\endgroup$
    – Mr.Wizard
    Commented Jul 10, 2012 at 16:46
  • 1
    $\begingroup$ @Mr.Wizard Do you like Block[{x}, ParametricPlot3D[ Evaluate[Table[{x, a, rp[x, a]}, {a, ratios}]], {x, 0, 10}, BoxRatios -> {10, 10, 5}] ] more ? Otherwise, I'd choose Evaluated->True in ParametricPlot3D. $\endgroup$
    – Artes
    Commented Jul 10, 2012 at 22:28
  • $\begingroup$ Block, Evaluated -> True, or simply the mention of the issue would do. You have my vote now anyway. $\endgroup$
    – Mr.Wizard
    Commented Jul 11, 2012 at 0:15
11
$\begingroup$

Some things to think about:

rp[x_, r_] := 1000 x (r + 1)/(r + x)

rp[x, #] & /@ ratios

Outer[rp, {x}, ratios][[1]]

Table[rp[x, i], {i, ratios}]

Block[{rp},
  rp[x, ratios] // Thread
]

And Formal Symbols (looks better in the Notebook):

ClearAll[rp]
rp[r_] := 1000 \[FormalX] (r + 1)/(r + \[FormalX])

Plot[rp /@ ratios, {\[FormalX], 0, 1}, Evaluated -> True]

Mathematica graphics

And this (see Parameterized function and Currying in Mathematica):

ClearAll[rp]
rp[x_][r_] := 1000 x (r + 1)/(r + x)

Plot[rp[x] /@ ratios, {x, 0, 1}, Evaluated -> True]

Mathematica graphics

Be sure to read this and this for an explanation of Evaluated -> True.

$\endgroup$
1
  • 1
    $\begingroup$ +1 Very nice: Plot[Outer[rp, {x}, ratios], {x, 0, 1}] $\endgroup$ Commented Jul 11, 2012 at 10:48
6
$\begingroup$

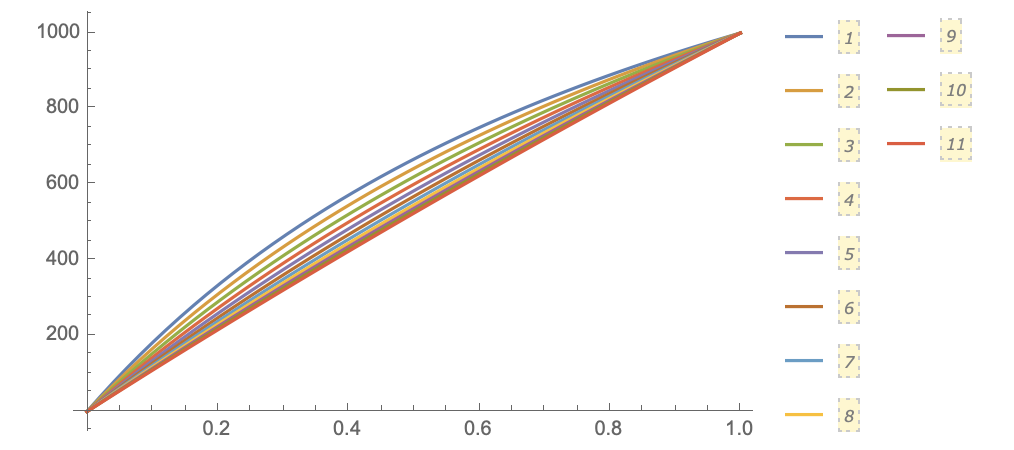
When using Evaluated->True the plot legends to not display or display only one item. The answer by Artes of using the Evaluate function on the first argument to Plot will also fix the issue with plot legends, so their answer is the best from that perspective.

Plot[Evaluate[Map[rp[x, #] &, ratios]], {x, 0, 1}, 
 PlotLegends -> Automatic]

This produces

enter image description here

$\endgroup$
1
  • 1
    $\begingroup$ Welcome to Mma.SE! This looks like an extended comment on the accepted answer; so make sure to reference it (e.g. "Fixing the PlotLegends issue in rm -rf's answer, ... " so this answer can stand on its own. $\endgroup$
    – lirtosiast
    Commented Jun 30, 2019 at 0:59

Your Answer

By clicking “Post Your Answer”, you agree to our terms of service and acknowledge you have read our privacy policy.

Not the answer you're looking for? Browse other questions tagged or ask your own question.