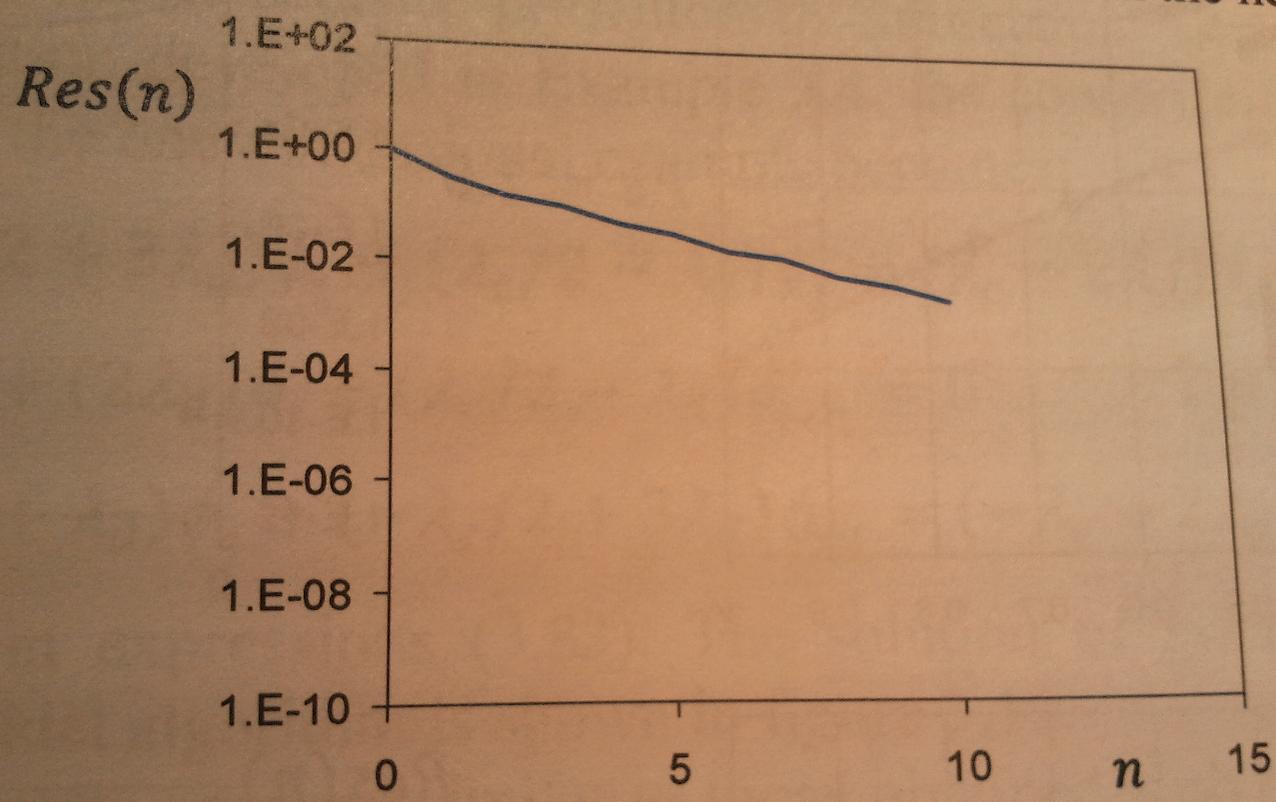
I have this picture of a residual Plot I am trying to reproduce (Y axis scale should be the same as in my plot):

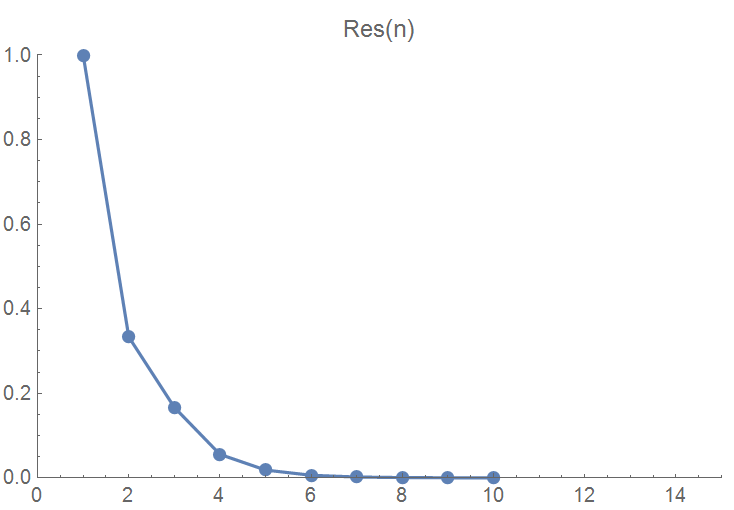
The code I have used is:
DiscretePlot[ResN[[i]], {i, 1, 10}, Joined -> True, Filling -> None,
     PlotMarkers -> "Point", PlotRange -> {{0, 15}, {0, 1}},
     PlotLabel -> "Res(n)"]`

ResN is a List with values for ten columns.
Any help would be appreciated. I browsed around for the answer, but without any success.


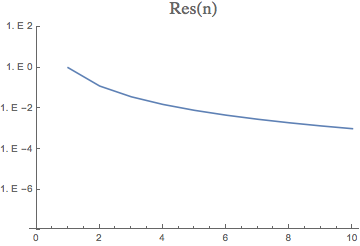
ListLogPlot? $\endgroup$