6
$\begingroup$

In version, 10 StreamPlot seems to calculate many more points along each streamline than necessary, compared to version 7.

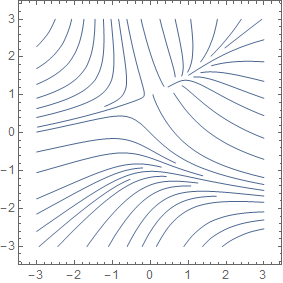
For example, from Mathematica documentation, the command

Block[{k = 0}, 
  StreamPlot[{-1 - x^2 + y, 1 + x - y^2}, {x, -3, 3}, {y, -3, 3}, 
    EvaluationMonitor :> k++]; k]

gives 184 points in version 7 and 3592 points in version 10. I could not find an option that reduces the number of points calculated. For the complicated function I am trying to plot, it makes more than a factor of 10 difference in speed.

$\endgroup$
3
  • 2
    $\begingroup$ Have you seen StreamPoints? $\endgroup$
    – user9660
    Commented Apr 3, 2015 at 6:30
  • 1
    $\begingroup$ StreamPoints controls the number of streamlines, not the number of points evaluated on each streamline. That is the question, is there an option that controls the number of points on each streamline $\endgroup$
    – Mike
    Commented Apr 6, 2015 at 16:34
  • $\begingroup$ I have the same problem. StreamPlot is really too slow.. and cant be used in Manipulate...even for a simple function. $\endgroup$
    – Nam Nguyen
    Commented Mar 18, 2016 at 15:31

1 Answer 1

2
$\begingroup$

I do not experience much difference in performance of StreamPlot between versions 7 and 10.1 with the example given. In fact 10.1 is faster than 7.0 at 0.22 seconds versus 0.28 seconds. (Times for generation and rendering combined.)

However I can confirm the EvaluationMonitor steps reported, therefore I think this is a change to EvaluationMonitor rather than a performance issue. It does not report all points used in the plotting. For example we can greatly slow down StreamPlot by specifying a higher MaxRecursion value yet the EvaluationMonitor count remains unchanged:

Block[{k = 0}, 
  StreamPlot[{-1 - x^2 + y, 1 + x - y^2}, {x, -3, 3}, {y, -3, 3}, 
    EvaluationMonitor :> k++,
    MaxRecursion -> 7];
  k
] // AbsoluteTiming

{6.61148, 3592}

Likewise MaxRecursion -> 0 plots somewhat faster than the default yet still returns a count of 3592. PerformanceGoal -> "Speed" does affect the count but also removes the stream arrows:

k = 0;

StreamPlot[{-1 - x^2 + y, 1 + x - y^2}, {x, -3, 3}, {y, -3, 3},  
  EvaluationMonitor :> k++,
  PerformanceGoal -> "Speed"]

k

enter image description here

2382
$\endgroup$
7
  • $\begingroup$ Thanks for looking into it, but to see real performance difference, one has to use more computationally complicated functions. Also, this example from the documentation actually plots the points being evaluated. I just added BesselJ to slow down the computation: Timing[ListPlot[ Reap[StreamPlot[{BesselJ[20, -1 - x^2 + y], BesselJ[20, 1 + x - y^2]}, {x, -3, 3}, {y, -3, 3}, EvaluationMonitor :> Sow[{x, y}]]][[-1, 1]]]] $\endgroup$
    – Mike
    Commented Jun 4, 2015 at 2:19
  • $\begingroup$ @Mike I am still not seeing a large difference in performance. In version 7 StreamPlot[{BesselJ[20, -1 - x^2 + y], BesselJ[20, 1 + x - y^2]}, {x, -3, 3}, {y, -3, 3}, MaxRecursion -> 0] takes 1.75 seconds and in 10.1 it takes 2.36 seconds on my machine. This is significant but far smaller in magnitude than e.g. this ListPlot backslide. I guess what I am saying is that while I am not happy with it being slower it is way down the list of things that need attention in my mind. $\endgroup$
    – Mr.Wizard
    Commented Jun 4, 2015 at 3:54
  • $\begingroup$ For the actual function I was trying to StreamPlot (too complicated to reproduce here) it was a full factor of 10 difference in speed. Looking at the plot of points that StreamPlot evaluates, it's clearly many more than necessary and more than a factor of 10 larger than in version 7. There doesn't seem to be any real way to control it since the "Speed" option does not reduce it significantly. So I think its a bug in the sampling algorithm. $\endgroup$
    – Mike
    Commented Jun 4, 2015 at 5:32
  • $\begingroup$ @Mike I encourage you to attempt to find a smaller example that exhibits this larger difference in timing and update the question. An order of magnitude difference is very significant and deserves attention if nothing else. Perhaps there is a work-around too. $\endgroup$
    – Mr.Wizard
    Commented Jun 4, 2015 at 13:45
  • 1
    $\begingroup$ Try Timing[StreamPlot[{Sum[If[n > 0, (-1 - x^2 + y), 0], {n, 1, 1000}], Sum[If[n > 0, (1 + x - y^2), 0], {n, 1, 1000}]}, {x, -3, 3}, {y, -3, 3}]]. Its a sum of 1000 identical terms. The If statement is to prevent Mathematica from compiling the expression, which gives funny scaling with n. This gives me in v. 7.0 a time of 1.6 sec and in v.10.0 a time of 18.3 sec. The number of points evaluated is identical to the example in documentation in each version, as expected. $\endgroup$
    – Mike
    Commented Jun 5, 2015 at 3:00

Your Answer

By clicking “Post Your Answer”, you agree to our terms of service and acknowledge you have read our privacy policy.

Not the answer you're looking for? Browse other questions tagged or ask your own question.