2
$\begingroup$

I have the following parametric equations

x0[u_, v_, a_, b_, c_] := a* Cos[u]*Sin[v]
y0[u_, v_, a_, b_, c_] := b* Sin[u]*Sin[v]
z0[u_, v_, a_, b_, c_] := c*Cos[v]

x1[u_, v_, a_, b_, c_] := 0
y1[u_, v_, a_, b_, c_] := b* Sin[u]*Sin[v]
z1[u_, v_, a_, b_, c_] := c*Cos[v]

Now I take the plots

g1 = ParametricPlot3D[{x0[u, v, 10, 3, 2], y0[u, v, 10, 3, 2], 
    z0[u, v, 10, 3, 2]}, {u, 0, 2 \[Pi]}, {v, 0, \[Pi]}, 
   Mesh -> None];

g2 = ParametricPlot3D[{x1[u, v, 10, 3, 2], y1[u, v, 10, 3, 2], 
   z1[u, v, 10, 3, 2]}, {u, 0, 2 \[Pi]}, {v, 0, \[Pi]}, Mesh -> None, 
  PlotStyle -> LightBlue]

How can I combine them in order the second plot to be visible (like an Epilog object for g1)?

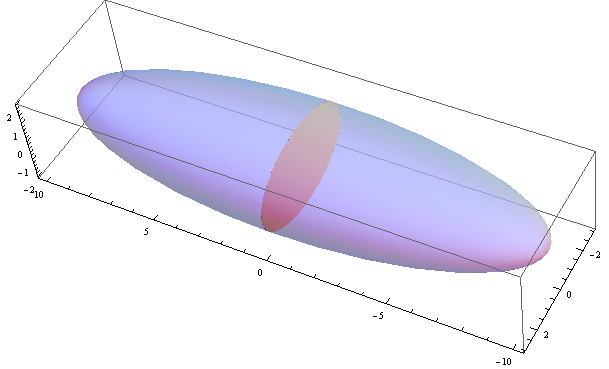
I want something like the following output

Show[g2, g1]

but the whole ellipsoid should be plot. Thank you.

$\endgroup$
5
  • $\begingroup$ add the option PlotStyle -> Opacity[.5] to g1 and use Show[g1,g2]? $\endgroup$
    – kglr
    Commented Feb 11, 2015 at 16:24
  • $\begingroup$ @kguler Sorry, didn't see your comment before posting. Moved my answer to CW $\endgroup$ Commented Feb 11, 2015 at 16:34
  • $\begingroup$ @kguler, thank for the answer $\endgroup$
    – Dimitris
    Commented Feb 11, 2015 at 16:49
  • $\begingroup$ @belisarius, happens to me all the time. Don't think it is necessary to make your answer CW - can you undo it? $\endgroup$
    – kglr
    Commented Feb 11, 2015 at 17:18
  • $\begingroup$ @kguler I don't care either. Let's keep it CW.:) $\endgroup$ Commented Feb 11, 2015 at 17:23

2 Answers 2

4
$\begingroup$
g1 = ParametricPlot3D[{x0[u, v, 10, 3, 2], y0[u, v, 10, 3, 2], 
   z0[u, v, 10, 3, 2]}, {u, 0, 2 π}, {v, 0, π}, Mesh -> None, 
  PlotStyle -> Opacity[.5]]

g2 = ParametricPlot3D[{x1[u, v, 10, 3, 2], y1[u, v, 10, 3, 2], 
   z1[u, v, 10, 3, 2]}, {u, 0, 2 π}, {v, 0, π}, Mesh -> None, 
  PlotStyle -> LightBlue]

Show[g1, g2]

Mathematica graphics

$\endgroup$
2
  • $\begingroup$ Moved to CW after seeing @kguler's comment ... $\endgroup$ Commented Feb 11, 2015 at 16:33
  • $\begingroup$ Belisarius, thank for the answer. By the way, I can reproduce this coloring for g1. Instead what I get is an orange-like coloring. How to modify it? $\endgroup$
    – Dimitris
    Commented Feb 11, 2015 at 16:53
1
$\begingroup$

Just for fun:

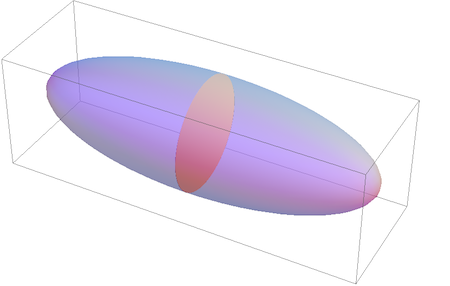
Graphics3D[{Opacity[.5], Scale[#, {3, 1, 1}], Opacity[1], 
    Scale[#, {.001, 1, 1}]} &@Sphere[]]

spheres

This (self-contained) short form is possible here because ellipsoids are just scaled spheres.

By the way, the Scale with 0.001 in the x direction is also a good way to render disks in 3D.

$\endgroup$
1
  • $\begingroup$ Thank you very much. No need for parametric equations:-)! $\endgroup$
    – Dimitris
    Commented Feb 11, 2015 at 16:50

Your Answer

By clicking “Post Your Answer”, you agree to our terms of service and acknowledge you have read our privacy policy.

Not the answer you're looking for? Browse other questions tagged or ask your own question.