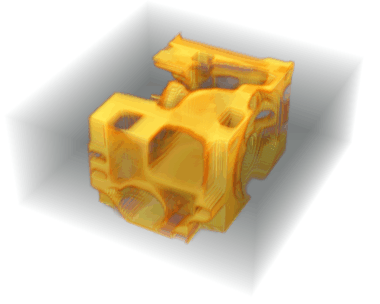
Image3D is great, but if you want to have fine-tuned control over the opacity then you need to go to DensityPlot3D, or, in this case, ListDensityPlot3D. These are new functions in version 10.2.
In the absence of OP's data, we'll have to invent some data. OP has a set of slices that together make up a 3D object. We can mimic this using Image3DSlices, and we'll use one of the examples from that page.
Get["http://pastebin.com/raw/x1BY2cpu"]
i

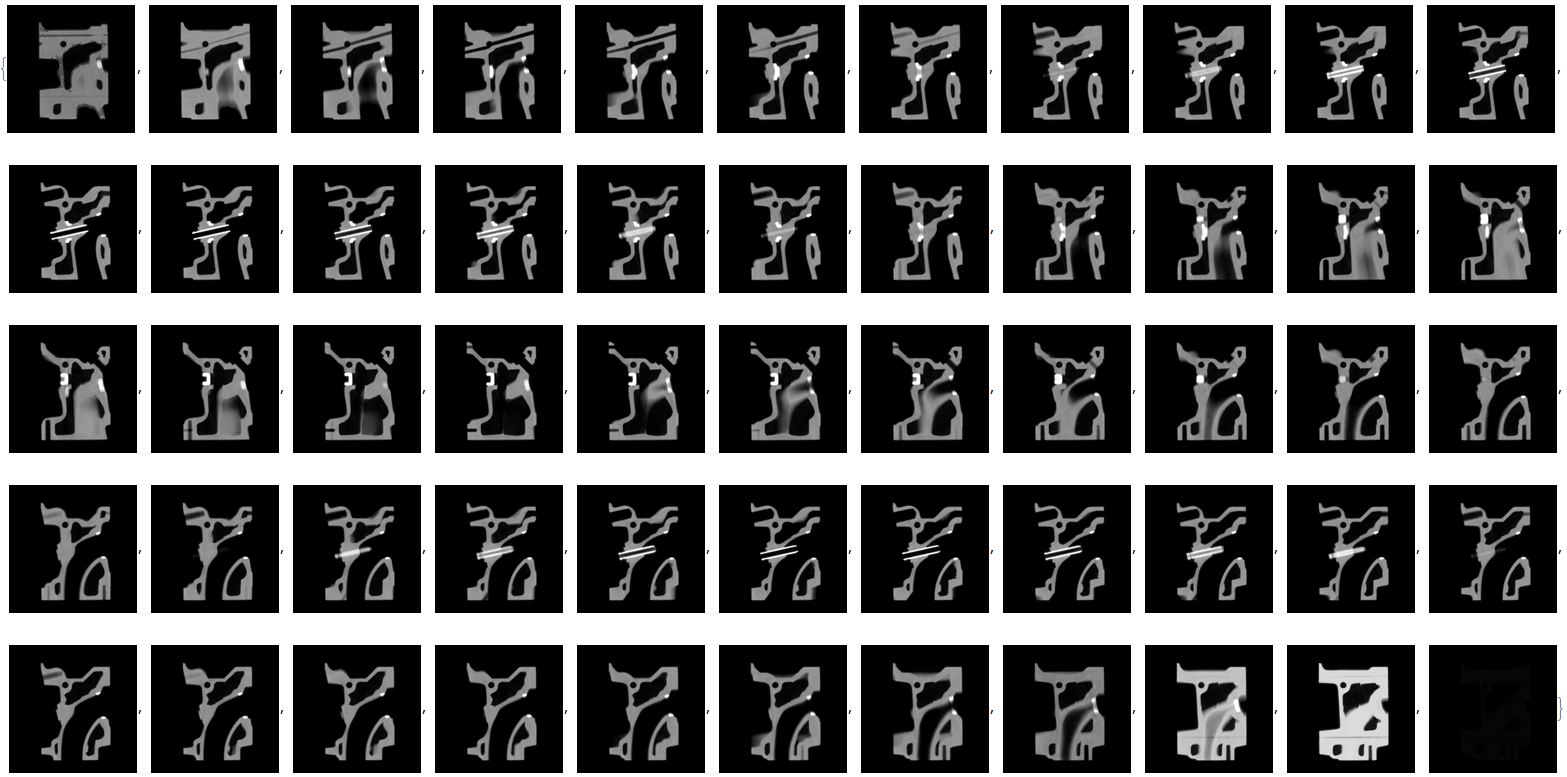
The slices are
Image3DSlices[i]

Now we could just feed these slices back to Image3D to get the original image, which is essentially what OP has done. But what I'd like to do is instead turn this into numeric data,
list = ImageData /@ Image3DSlices[i];
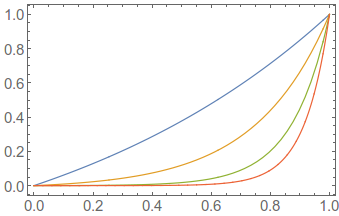
Now we need to deal with the opacity of the 3D density plot. DensityPlot3D and ListDensityPlot3D can take both an OpacityFunction and a ColorFunction, each of which has Scaling option. By default, the plot will feed scaled values to the opacity function, values between 0 and 1, and map these to opacity values that are also between zero and one. I have toyed around and I like using an exponential opacity function with an adjustable parameter. Here is what it looks like with a few different values of this parameter
Plot[Evaluate[(Exp[# f] - 1)/(E^# - 1) & /@ {1, 4, 8, 12}], {f, 0, 1}]

So the blue curve will scale the opacity nearly linearly with the function value (the brightness of the image), while the red curve will make only the largest values opaque.
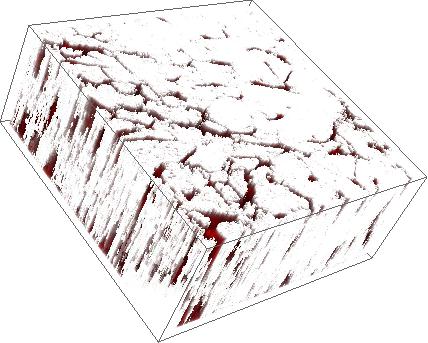
Now let's use this opacity function with a density plot, and here I've specified the viewpoint since my machine is slow when manually rotating a 3D density plot,
ListDensityPlot3D[list,
   OpacityFunction -> Function[f, (Exp[# f] - 1)/(E^# - 1)],
   ColorFunction -> Hue,
   ViewPoint -> {-1.18, -0.05, 3.18},
   ViewVertical -> {-0.96, 0, 0.27},
   ImageSize -> 300] & /@ {1, 4, 8, 12}

By adjusting the opacity you can hide or highlight the internal structure. It's far too intensive, at least on my machine, to be able to pair with Manipulate and see the opacity changes in real time, but this may change in future implementations.
Another point, is that since this is a ListPlot variant instead of an Image3D, you can specify the DataRange or change the Ticks in any way you want.


ColorFunctioneditors, I have a post on Wolfram Community that might be helpful for you. See here. $\endgroup$