I want to draw a region but the result of Mathematica is not good. Why?
Clear[x1, x2]
g1[x1_, x2_] := x1^4 - x2 + 1;
g2[x1_, x2_] := -x1^3 + x2 - 1;
f[x1_, x2_] :=
  Which[g1[x1, x2] <= 0 && g2[x1, x2] <= 0, (x1 + 1)^2 + (x2 + 1)^2];
fextend[x1_, x2_] := (x1 + 1)^2 + (x2 + 1)^2;

RegionPlot[
 g1[x1, x2] <= 0 && g2[x1, x2] <= 0, {x1, -0.5, 1.2}, {x2, -2, 2.1},
 PlotStyle -> {Directive[Black, Opacity[0.4]]}, ImageSize -> Large]
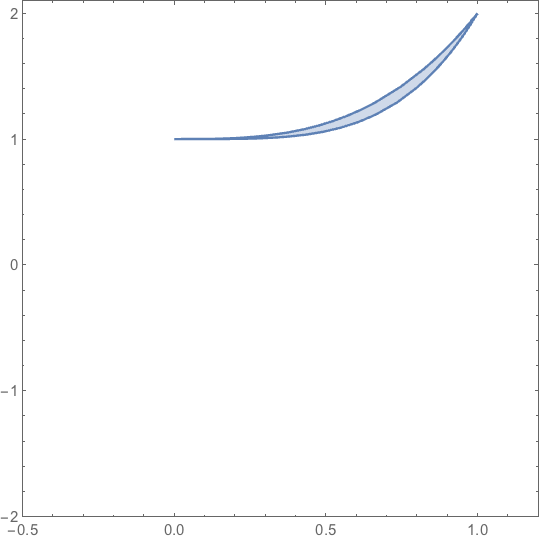
The good region is

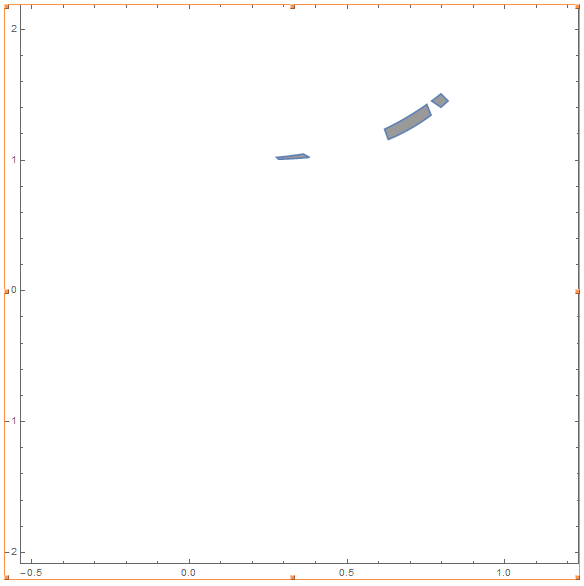
But the result that Mahematica 10 windows 64 bits shows is:

How can you improve the result?
I was trying but the only solution that I encountered is use Plot instead of RegionPlot.
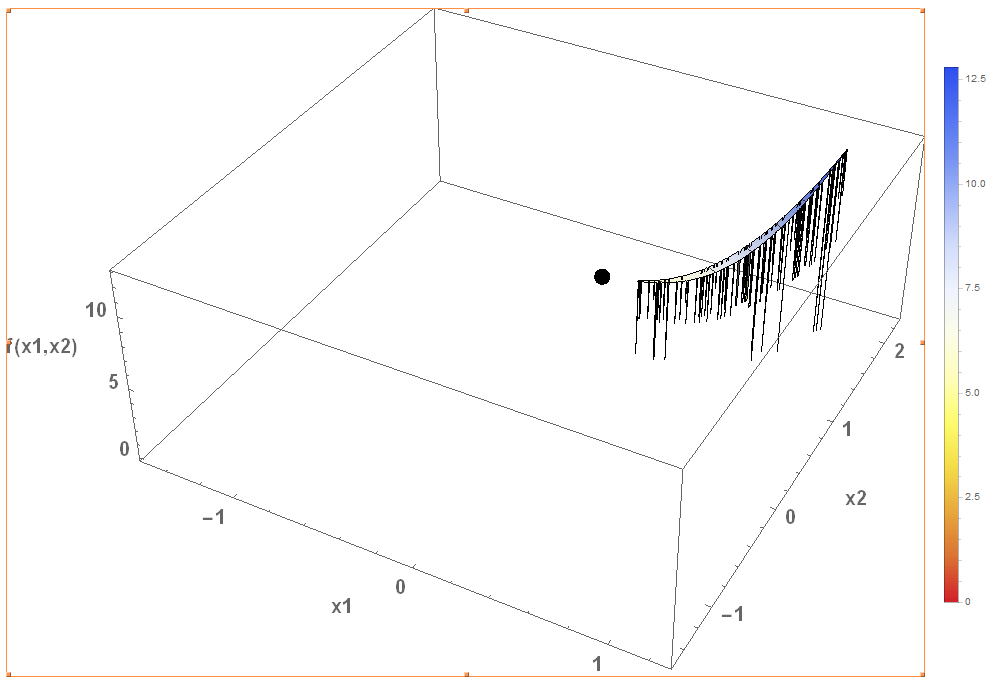
Similar to that trouble is this other in Plot3D, as you can see
g1[x1_, x2_] := x1^4 - x2 + 1;
g2[x1_, x2_] := -x1^3 + x2 - 1;
f[x1_, x2_] :=
  Which[g1[x1, x2] <= 0 && g2[x1, x2] <= 0, (x1 + 1)^2 + (x2 + 1)^2];
p3d = Plot3D[f[x1, x2], {x1, -1.5, 1.25}, {x2, -1.5, 2.25},
   MeshFunctions -> {#3 &}, Mesh -> 10,
   AxesLabel -> {x1, x2, "f(x1,x2)"}, LabelStyle -> {20, Bold},
   ColorFunction -> ColorData[{"TemperatureMap", "Reverse"}],
   ImageSize -> Large, PlotLegends -> Automatic, PlotPoints -> 300];
punto = Graphics3D[{Black, PointSize[0.020], Point[{0, 1, f[0, 1]}]}];
Show[p3d, punto]
What´s the solution in this case to avoid all that black lines in the limit of region?


fandfextend? They seem to have nothing to do with the question. They should probably be removed from the question. $\endgroup$