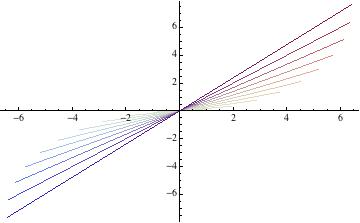
I have a ListLinePlot, and I want the ColorFunction to vary as the angle, so that the color of the whole line depends on its angle from the x-axis. Here is a MWE of what I am doing:
test = Table[{i, 5 i}, {i, 1, 10}];
ListLinePlot[
  Table[{{-test[[i, 1]] Cos[test[[i, 2]] Degree], -test[[i, 1]] Sin[
  test[[i, 2]] Degree]}, {test[[i, 1]] Cos[test[[i, 2]] Degree], test[[i, 1]] Sin[test[[i, 2]] Degree]}}, {i, 1, 10}],
  ColorFunction -> "ThermometerColors", ColorFunctionScaling -> True]
As expected, this produces

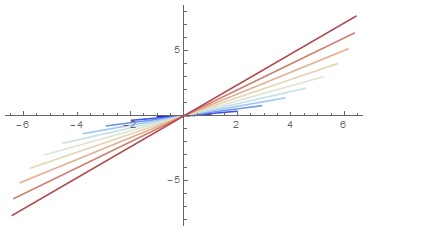
How do I construct the ColorFunction so that the "minimum" and "maximum" color correspond to the angle of inclination, i.e. so that the minimum angle (5 Deg in this case) gives a blue line, and the maximum angle gives a red line?


Graphics+Line+ some color function. $\endgroup$Hueor customBlendetc. $\endgroup$Hue[ArcTan[x,y]], and it seems to color it like I want, except only the negative half of the line is colored. $\endgroup$ArcTanruns from -π to π. Check outRescale. E.g.Hue[Rescale[ArcTan[x,y],{-Pi,Pi}]]or something like that. $\endgroup$