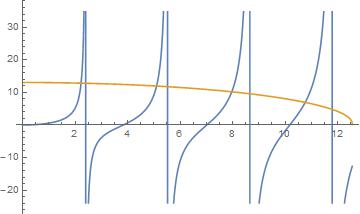
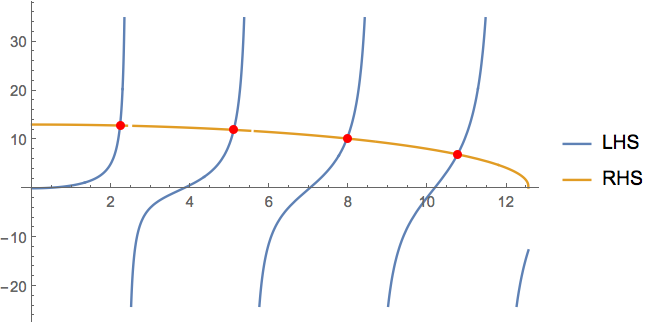
I have two Bessel functions, and I need to be able to count the number of intersections if both functions are plotted dependent upon the same variable. I can use FindRoot or FindInstance to get one specific intersection, but because these are not polynomials I can't use Solve or NSolve to find all solutions at one time and then simply CountInstance the list.
What I really want to do is have a full script that will count and sum the number of instances for every n-value of the Bessel function in a given range (the variable "l" in my script). For small values of constants at the beginning of my script (specifically, "a"), the total number of intersections for all values "l" will be in the dozens at most, so I can simply plot and count manually. However, for larger values, the number of counts will be closer to 1 million. Additionally, I'd like to be able to plot the number of counts versus the value of some of the inputs eventually, so it would be really nice to have this part automated.
Any ideas? Even if I can just get a script or Mathematica function that can list all of the intersections that would be a big help. I've pasted my code so far below- please forgive and advise any incorrect formatting, as I've never posted here before. Thanks! 
a = 2000;

n1 = 1.76;

n2 = 1.0;

λ = 1450;

NA = (n1^2 - n2^2)^(1/2);

V = 2*Pi*a/λ*NA

k0 = (2*Pi)/λ;

kT = (n1^2*k0^2 - Β^2)^(1/2);

γ = (Β^2 - n2^2*k0^2)^(1/2);

Y = (V^2 - X^2)^(1/2);

l = 0;

LHS = X*(BesselJ[l + 1, X]/BesselJ[l, X]);

RHS = Y*(BesselK[l + 1, Y]/BesselK[l, Y]);

Plot[{LHS, RHS}, {X, 0, V}]

