10
$\begingroup$

I am trying to plot a simple function

F[x_, y_] := 1/x If[y < x^2 + 2 x && y > Abs[x^2 - 2 x], 1 - 1/4 (x - y/x)^2, If[y > 0 && y < -x^2 + 2 x, y, 0]]

in a simple way:

g1 = Plot3D[F[x, y], {x, 0, 2.5}, {y, 0, 11}, BoxRatios -> {3, 3, 2.2},PlotPoints ->{30, 30}, PlotRange -> {0, 1.5}, MeshFunctions -> {#1 &}, Lighting -> "Neutral", Filling -> Bottom, FillingStyle -> Opacity[1]];
g2 = Plot3D[F[x, y], {x, 0, 2.5}, {y, 0, 11}, BoxRatios -> {3, 3, 2.2},PlotPoints -> {30, 30}, PlotRange -> {0, 1.5}, MeshFunctions -> {#1 &}, Lighting -> {{"Ambient", White}}, Filling -> Bottom, FillingStyle -> Opacity[1]];
gr = GraphicsRow[ Show[#, Boxed -> False, Axes -> None, ViewPoint -> {1.8, 2.5, 1.3}] & /@ {g1, g2}, ImageSize -> Full]

and find a lot of artefacts, see below:
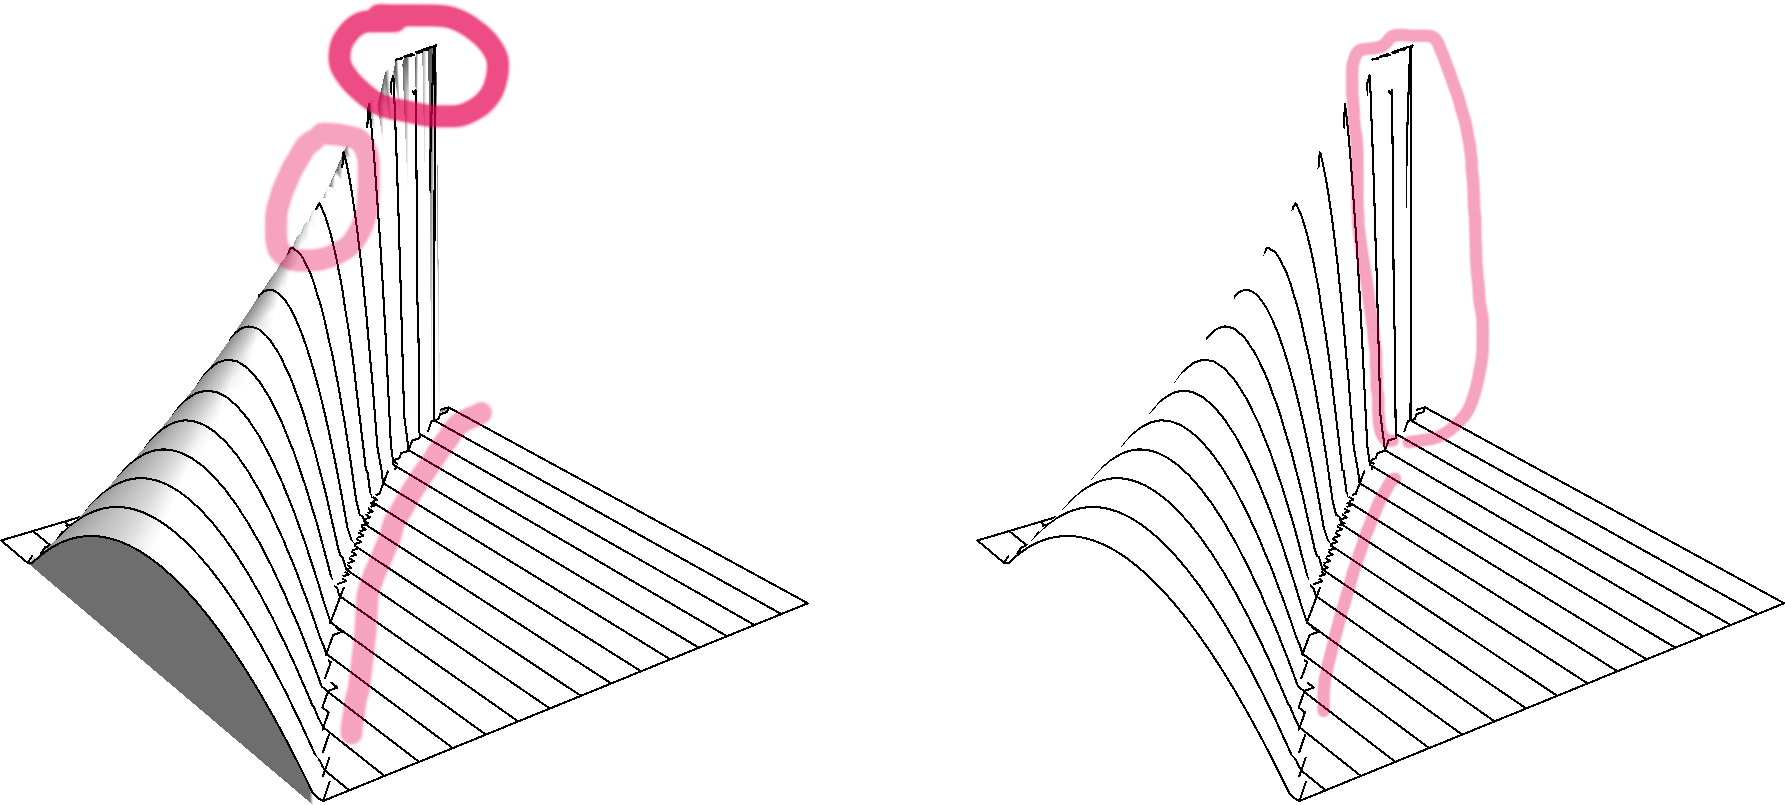
2 plots

The problems I marked here can be reduced somehow by increasing the number of PlotPoints. However, I never manage to get rid of them (artefacts, not points) completely. Most disturbing things are:

  • A curve running across the plane (on both plots). As I understood there should only the Mesh lines be visible;
  • Discontinuous vertical line in the second plot;
  • Strange shadows on the top of first plot.

Any help is greatly appreciated.

$\endgroup$
6
  • 1
    $\begingroup$ Using the option MaxRecursion -> 10 greatly reduces the problem $\endgroup$
    – rhermans
    Commented Oct 23, 2014 at 18:25
  • $\begingroup$ yarchik, do you get what you need if you use PlotPoints -> {80, 80}, BoundaryStyle -> None, MaxRecursion -> 5 (or higher values for PlotPoints and MaxRecursion)? $\endgroup$
    – kglr
    Commented Oct 23, 2014 at 18:33
  • 1
    $\begingroup$ I recommend that you define F using Piecewise rather than If: F[x_, y_] := Piecewise[{{(1 - 1/4 (x - y/x)^2)/x, y < x^2 + 2 x && y > Abs[x^2 - 2 x]}, {y/x, y > 0 && y < -x^2 + 2 x}}]. Note that Maximize[{F[x, y], 0 <= x <= 2.5, 0 <= y <= 11}, {x, y}] gives {1.97433, {x -> 0.0256689, y -> 0.050679}}. Since the maximum is greater than your specified PlotRange, you are clipping the Plot and causing the artifact near the maximum. Use PlotRange -> All $\endgroup$
    – Bob Hanlon
    Commented Oct 23, 2014 at 18:56
  • $\begingroup$ I would like to comment on these suggestions and on the answer from @rhermans and Craig Carter. They are not satisfactory as they address only minor issues and do not solve the main problem of removing the curved line in the x-y plane. $\endgroup$
    – yarchik
    Commented Oct 24, 2014 at 13:15
  • $\begingroup$ @Bob Hanlon My PlotRange was chosen intensionally. I do prefer to have clipping. $\endgroup$
    – yarchik
    Commented Oct 24, 2014 at 13:17

2 Answers 2

12
$\begingroup$

This behaves better with a RegionFunction:

p1 =
 Plot3D[(1 - 1/4 (x - y/x)^2)/x, { x, 0, 2.5}, {y, 0, 11}, 
  BoxRatios -> {3, 3, 2.2}, PlotPoints -> {30, 30}, 
  PlotRange -> {0, 3.5}, MeshFunctions -> {#1 &}, 
  Lighting -> "Neutral", ClippingStyle -> Opacity[1]]

p2 =
 Plot3D[0.00001, { x, 0, 2.5}, {y, 0, 11}, BoxRatios -> {3, 3, 2.2}, 
  PlotPoints -> {30, 30}, PlotRange -> {0, 1.5}, 
  MeshFunctions -> {#1 &}, Lighting -> "Neutral", Filling -> Bottom, 
  FillingStyle -> Opacity[1],
  RegionFunction -> 
   Function[{x, y}, ! (y < x^2 + 2 x && y > Abs[x^2 - 2 x] ) ]
  ]

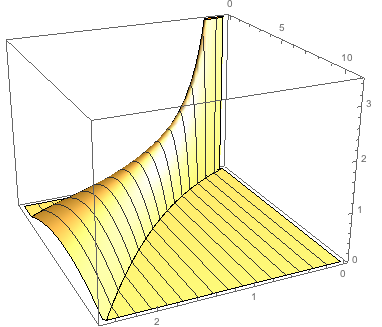
Show[p1, p2]

result of Show with a Region Function

But, I think this is more appealing:

Plot3D[(1 - 1/4 (x - y/x)^2)/x, { x, 0, 2.5}, {y, 0, 11}, 
 BoxRatios -> {3, 3, 2.2}, PlotPoints -> {30, 30}, 
 PlotRange -> {0, 3.5}, MeshFunctions -> {#1 &}, 
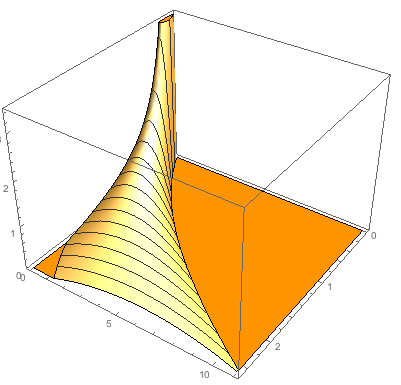
 Lighting -> "Neutral", ClippingStyle -> Orange]

Result of color for clippingstyle

$\endgroup$
1
  • $\begingroup$ I think you made a mistake in defining the function. There are two different domains. Concerning the use of color, I do not think it conveys some additional information. I am for puristic style. $\endgroup$
    – yarchik
    Commented Oct 24, 2014 at 13:22
11
$\begingroup$

Using the option MaxRecursion -> 8 greatly reduces the problem in a better way than PlotPoints as points are added only in the regions where is needed i.e. with big first and second derivatives.

Here is with an overkill of MaxRecursion -> 12 and WorkingPrecision -> 22 just to be sure.

g1 = Plot3D[F[x, y], {x, 0, 2.5}, {y, 0, 11}, 
   BoxRatios -> {3, 3, 2.2}, PlotPoints -> {30, 30}, 
   PlotRange -> {0, 1.5}, MeshFunctions -> {#1 &}, 
   Lighting -> "Neutral", Filling -> Bottom, 
   FillingStyle -> Opacity[1], MaxRecursion -> 12, 
   WorkingPrecision -> 22];
g2 = Plot3D[F[x, y], {x, 0, 2.5}, {y, 0, 11}, 
   BoxRatios -> {3, 3, 2.2}, PlotPoints -> {30, 30}, 
   PlotRange -> {0, 1.5}, MeshFunctions -> {#1 &}, 
   Lighting -> {{"Ambient", White}}, Filling -> Bottom, 
   FillingStyle -> Opacity[1], MaxRecursion -> 12, 
   WorkingPrecision -> 22];
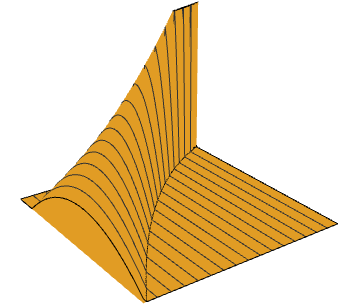
gr = GraphicsRow[
  Show[#, Boxed -> False, Axes -> None, 
     ViewPoint -> {1.8, 2.5, 1.3}] & /@ {g1, g2}, ImageSize -> Full]

enter image description here

$\endgroup$
1
  • 1
    $\begingroup$ Thank you for your suggestions. MaxRecursion -> 12 and WorkingPrecision -> 22 is indeed an overkill. Besides, it does not remove the curve in x-y plane, it just makes it smooth. I wonder what is its origin? $\endgroup$
    – yarchik
    Commented Oct 24, 2014 at 13:20

Your Answer

By clicking “Post Your Answer”, you agree to our terms of service and acknowledge you have read our privacy policy.

Not the answer you're looking for? Browse other questions tagged or ask your own question.