21
$\begingroup$

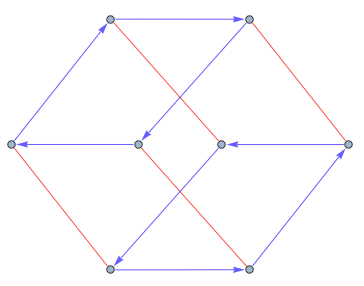
The Cayley graphs produced by Mathematica 8.0's CayleyGraph function represent actions that are their own inverses in an unconventional way: rather than using a single edge without arrows, it uses two edges, each represented by an arrow.

Is there a way to replace all (and only) pairs of such reflexive arrows in a Cayley diagram with a single undirected edge, while leaving any unpaired directed edges untouched?

For example is there a way to make edges in this

CayleyGraph[DihedralGroup[4]]

enter image description here

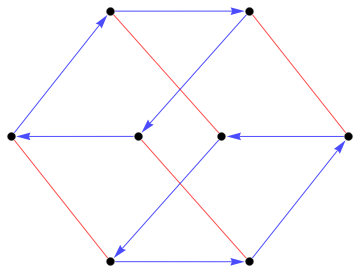
look like this

enter image description here


Note that I'm aware that one could generate the desired output "manually", using Graph (as was done to generate the example above), but the solution I'm seeking must work for far more complex graphs than the one illustrated here from the simple group specifications that can be provided to CayleyGraph.

$\endgroup$
2
  • $\begingroup$ I suspect that the correct approach involves some searching (I'm not sure where) for matching pairs of \[DirectedEdge], and then replacing (using EdgeDelete and EdgeAdd) those with a single \[UndirectedEdge] (somehow of the same color). But I have no idea how to do that. Alternately, in may be that a this requires a replacement for CayleyGraph that builds a graph from scratch (e.g., from some form of group specification or the output of GroupGenerators and GroupElements). $\endgroup$
    – orome
    Commented May 31, 2012 at 18:41
  • $\begingroup$ I just tried that, but got a message Graph::supp: Mixed graphs and multigraphs are not supported. No idea what that means. I can't check the result right now (for running the front end over the internet I just don't have the necessary bandwidth, so I can only use the kernel right now). Anyway, here's my code: Module[{vl=VertexList[#], el=EdgeList[#]}, Graph[vl, el /. {x_ \[DirectedEdge] y_ /; el ~MemberQ~ (y \[DirectedEdge] x) :> If[Order[x, y]==1, x \[UndirectedEdge] y, Unevaluated@Sequence[]]}]]& $\endgroup$
    – celtschk
    Commented May 31, 2012 at 22:48

5 Answers 5

13
$\begingroup$

You can use custom EdgeShapeFunction as in

ClearAll[fromDirectedToMixedGraph]; 
fromDirectedToMixedGraph[g_Graph] :=  
   Module[{edges = (EdgeList[g]) //  DeleteDuplicates[#, Sort@#1 == Sort@#2 &] &,
   vertices = VertexList[g], vcoords = AbsoluteOptions[g, VertexCoordinates], 
esf = EdgeShapeFunction -> (If[MemberQ[(Pick[
       EdgeList[g], (Count[EdgeList[g], # | Reverse[#]] > 1) & /@ 
        EdgeList[g], False]), #2 | Reverse[#2]], Arrow[#1], Line[#1]] &), options},
options = {First@# -> Select[Last@#, (MemberQ[edges, First@#] &)]} & /@ (Options[g]);
Graph[vertices, edges, vcoords, esf, options]]

Example:

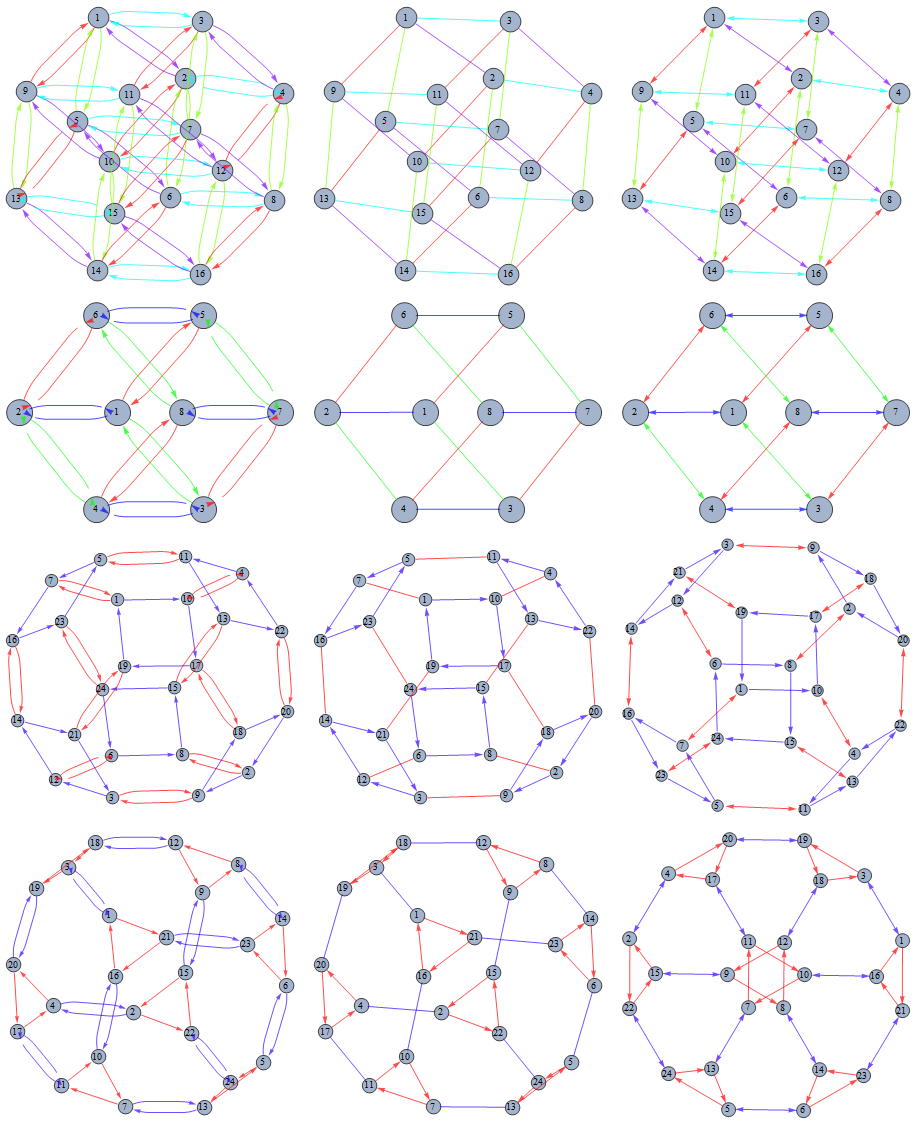
Grid@Table[{g, fromDirectedToMixedGraph[g]}, {g, {CayleyGraph[DihedralGroup[4]], 
  CayleyGraph[AbelianGroup[{2, 2, 2, 2, 2}]]}}]

enter image description here

EDIT: The following variant adds two options to control the rendering of multiple edges (as lines or bi-directional arrows). It also allows inheriting the options from the input graph and using any Graph option.

ClearAll[mixedEdgeGraph];
Options[mixedEdgeGraph] = Join[Options[Graph], 
         {"arrowSize" -> .03, "setBack" -> .1, "biDirectionalEdges" -> "line"}];

mixedEdgeGraph[g_Graph, opts : OptionsPattern[mixedEdgeGraph]] := 
 Module[{doubleEdges, singleEdges, vcoords, esf, options, 
 edges = DeleteDuplicates[EdgeList[g], Sort@#1 == Sort@#2 &],vertices = VertexList[g]},
 {doubleEdges, singleEdges} =  DeleteDuplicates[#, Sort@#1 == Sort@#2 &] & /@ 
     (Pick[EdgeList[g], (MemberQ[EdgeList[g], Reverse[#]]) & /@ 
           EdgeList[g], #] & /@ {True, False});

(* remove from Options[g] properties and option values that belong to deleted edges *)
options = Sequence @@ DeleteCases[
 Options[g], (e_ -> __) /;  MemberQ[Complement[EdgeList[g], edges], e], {1, Infinity}];

(* default EdgeShapeFunction to render multi-edges as lines or bidirectional arrows*)
esf = If[FilterRules[{opts}, EdgeShapeFunction] =!= {}, 
         FilterRules[{opts}, EdgeShapeFunction], 
         EdgeShapeFunction -> (If[MemberQ[singleEdges, #2 |Reverse[#2]], 
         {Arrowheads[{{OptionValue["arrowSize"], 1}}], Arrow[#1, OptionValue["setBack"]]}, 
     {If[OptionValue["biDirectionalEdges"] =!= "line", 
        Arrowheads[{-OptionValue["arrowSize"], OptionValue["arrowSize"]}],
        Arrowheads[{{0., 1}}]], Arrow[#1, OptionValue["setBack"]]}] &)];

(* use vertex coordinates of g unless VertexCooordinates or GraphLayout is specified *)
vcoords =  If[FilterRules[{opts}, {GraphLayout}] =!= {}, 
   VertexCoordinates -> Automatic, AbsoluteOptions[g, VertexCoordinates]];

(* explictly provided Graph options override the default options inherited from g *)
Graph[vertices, edges, FilterRules[{opts}, Options[Graph]], vcoords, esf, options]]

Examples:

optns = Sequence @@ {VertexLabels -> Placed["Name", Center], 
                     VertexSize -> 0.4, ImageSize -> 300};
g1 = CayleyGraph[AbelianGroup[{2, 2, 2, 2}], optns];
g2 = CayleyGraph[AbelianGroup[{2, 2, 2}], optns];
g3 = CayleyGraph[SymmetricGroup[4], optns];
g4 = CayleyGraph[PermutationGroup[{Cycles[{{1, 5, 4}}], Cycles[{{3, 4}}]}], optns];

enter image description here

Additional examples:

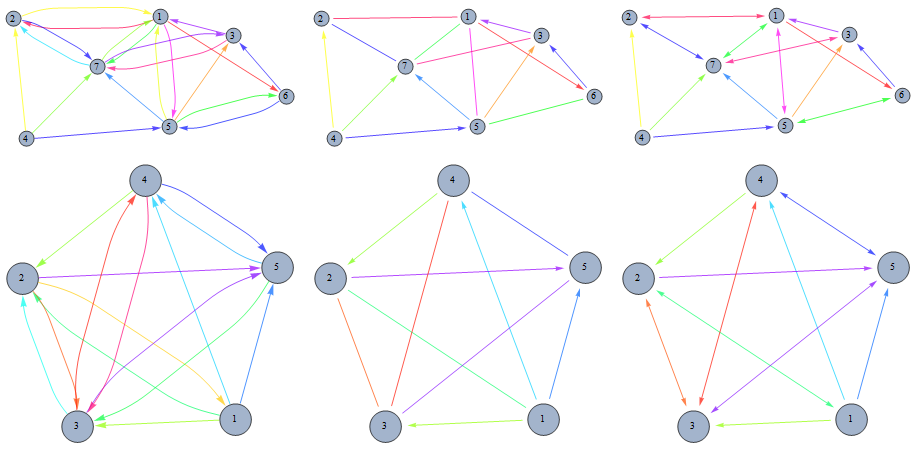
g5 = RandomGraph[BernoulliGraphDistribution[7, 0.6], DirectedEdges -> True, 
          VertexLabels -> Placed["Name", Center], VertexSize -> 0.2, ImageSize -> 300];
g6 = AdjacencyGraph[{{0, 1, 1, 1, 1}, {1, 0, 1, 0, 1}, {0, 1, 0, 1, 1}, 
                    {0, 1, 1, 0, 1}, {0, 0, 1, 1, 0}}, 
        DirectedEdges -> True,  VertexLabels -> Placed["Name", Center],
        VertexSize -> 0.2,    ImageSize -> 300];
(PropertyValue[{g5, #}, EdgeStyle] = Hue[RandomReal[]]) & /@  EdgeList[g5];
(PropertyValue[{g6, #}, EdgeStyle] = Hue[RandomReal[]]) & /@  EdgeList[g6];
Grid[{#, mixedEdgeGraph[#], 
         mixedEdgeGraph[#, GraphLayout -> "SpringElectricalEmbedding", 
                         "biDirectionalEdges" -> "doublearrows"]} & /@ {g5, g6}]

enter image description here

$\endgroup$
2
  • $\begingroup$ Thanks! I'd also like to be able substitute colors, but I'm bot sure how to modify the code above to do that. For example, I'd like to make all blue edges, say, magenta. I'd also like to rep ace the arrowhead style with something more like the one shown here. $\endgroup$
    – orome
    Commented Jun 7, 2012 at 19:43
  • 1
    $\begingroup$ @raxa ... Two ways to do that without changing the code: you can use something like: Define, (say, for the example graph g2) newedgstyl = Options[g2, EdgeStyle] /. Hue[0.666666666666666] -> Hue[0.8], and then use it as mixedEdgeGraph[SetProperty[g2, EdgeStyle -> newedgstyl[[1, 2]]]]. Or, you can use it as SetProperty[mixedEdgeGraph[g2], EdgeStyle -> newedgstyl[[1, 2]]]. $\endgroup$
    – kglr
    Commented Jun 7, 2012 at 20:35
9
$\begingroup$

The previous answers are wonderful. But at the risk of being repetitive, here is another answer. I believe what you really desire is to replace multi-directed edges with bi-directed edges as well as identifying group elements via tooltips and distinguishing unity. For example:

CG[PermutationGroup[{Cycles[{{1, 5, 4}}], Cycles[{{3, 4}}]}], 3]
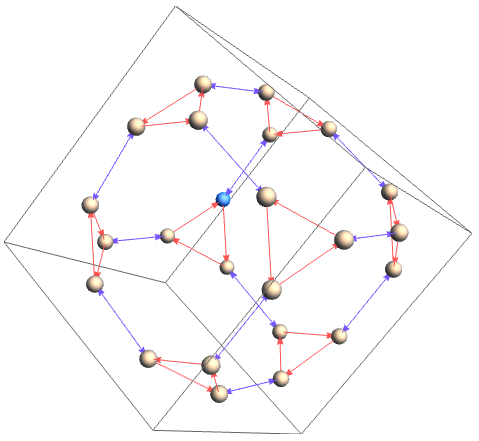
enter image description here

CG[PermutationGroup[{Cycles[{{1, 5, 4}}], Cycles[{{3, 4}}]}], 2]

enter image description here

In this fashion distractions are minimized. Here is the code:

mc[n : {___Integer}, func_List, list_List] := 
  Map[Fold[MapAt[#2[[1]], #1, List /@ #2[[2]]] &, #, 
     Transpose[{func, n}]] &, list];
mc[n : {___Integer}, func_, list_List] := 
  Map[MapAt[func, #, List /@ n] &, list];
mc[n_Integer, func_, list_List] := Map[MapAt[func, #, n] &, list];

formatCycles[c_Cycles] := 
  Row[Riffle[Row[Flatten@{"(", Riffle[#, " "], ")"}] & /@ c[[1]], 
    " "]];
formatCycles[c_] := 
  Row[Flatten[({"(", If[Length[#] > 1, Riffle[#, " "], #], ") "}) & /@
      c[[1]]]];
formatCycles[c_] := "" /; Sort[c] == c;
formatCycles[{}] := Style["(identity)", Gray];
formatCycles[Cycles[{}]] := Style["(identity)", Gray];
formatCycles[Cycles[{{}}]] := Style["(identity)", Gray];
$imageSize = 300;

CG[group_, dim_] := 
 Module[{v, e, edgeStyle, edgeColor, tools, eTool, vTool, ef, vf, 
   len, $CG, tooltips}, $CG = CayleyGraph[group];
  tooltips = AbsoluteOptions[$CG, Properties][[1, 2]];
  v = VertexList[$CG];
  len = Length[v];
  e = Rule @@@ EdgeList[$CG];
  edgeStyle = PropertyValue[$CG, {EdgeStyle}][[1, 2]];
  tools = 
   SplitBy[Sort[AbsoluteOptions[$CG, Properties][[1, 2]]], 
    Length[First[#]] &];
  (edgeColor[List @@ #1] = Lighter@#2[[1]]) & @@@ 
   mc[1, Rule @@ # &, edgeStyle];
  (vTool[First[#]] = formatCycles@Last[#][[1, 2]]) & /@ tools[[1]];
  (eTool[List @@ First[#]] = formatCycles@Last[#][[1, 2]]) & /@ 
   tools[[2]];
  If[len > 30, 
   If[dim == 2, 
    ef = ({edgeColor[#2], Arrowheads -> Medium, 
        Tooltip[Arrow[#1, 0.01], eTool[#2]]} &);
    vf = ({Lighting -> "Neutral", EdgeForm[Black], 
        RGBColor[0.696078431372549, 0.7588235294117647, 
         0.845098039215686], 
        Tooltip[If[
          len < 60, {Disk[#, .1], Black, Text[#2, #1]}, {Black, 
           Point[#]}], vTool[#2]]} &); 
    GraphPlot[e, EdgeRenderingFunction -> ef, 
     VertexRenderingFunction -> vf, ImageSize -> $imageSize, 
     ImageMargins -> 0, PlotRangePadding -> 0, ImagePadding -> None, 
     MultiedgeStyle -> 0.001], 
    ef = ({edgeColor[#2], Arrowheads -> Small, 
        Tooltip[Arrow[#1], eTool[#2]]} &);
    vf = ({Lighting -> "Neutral", Specularity[Brown, 3], Brown, 
        Tooltip[If[
          len < 60, {Sphere[#, 0.05], Black, 
           Text[#2, #1]}, {Sphere[#, .1]}], vTool[#2]]} &); 
    GraphPlot3D[e, EdgeRenderingFunction -> ef, ViewAngle -> All, 
     PlotRangePadding -> 0, ImageSize -> $imageSize, Boxed -> False, 
     PlotRangePadding -> 0 ImageMargins -> 0, ImagePadding -> 0, 
     MultiedgeStyle -> 0.001]], 
   If[dim == 2, 
    ef = ({edgeColor[#2], Arrowheads -> Medium, 
        Tooltip[Arrow[#1, 0.12], eTool[#2]]} &);
    vf = ({EdgeForm[{Black}], 
        If[#2 == 1, Blue, RGBColor[0.639216, 0.705882, 0.8]], 
        Tooltip[{Disk[#, 0.05]}, vTool[#2]]} &);
    GraphPlot[e, EdgeRenderingFunction -> ef, 
     VertexRenderingFunction -> vf, ImageSize -> $imageSize, 
     ImageMargins -> 0, PlotRangePadding -> 0, ImagePadding -> 10, 
     MultiedgeStyle -> 0.001], 
    ef = ({edgeColor[#2], Arrowheads -> Medium, 
        Tooltip[Arrow[#1], eTool[#2]]} &);
    vf = ({Lighting -> "Neutral", Specularity[Brown, 3], 
        If[#2 == 1, Hue[0.6], Gray], 
        Tooltip[If[len < 60, {Sphere[#, 0.1]}, {Point[#]}], 
         vTool[#2]]} &);
    GraphPlot3D[e, EdgeRenderingFunction -> ef, 
     VertexRenderingFunction -> vf, ImageSize -> $imageSize, 
     Boxed -> True, PlotRangePadding -> 0, ImageMargins -> 0, 
     ImagePadding -> 0, MultiedgeStyle -> 0.001]]]]
$\endgroup$
8
$\begingroup$

Here is a complex Cayley graph:

g = CayleyGraph[AbelianGroup[{2, 2, 2, 2, 2}]]

enter image description here

And here is its beautiful none-directed edge counterpart:

AdjacencyGraph[
    AdjacencyMatrix[g],
    AbsoluteOptions[g,VertexCoordinates],
    EdgeStyle->((EdgeStyle/.AbsoluteOptions[g,EdgeStyle])/.(x_\[DirectedEdge]y_)->
    (x\[UndirectedEdge]y)),
    DirectedEdges -> False]

enter image description here

$\endgroup$
8
  • $\begingroup$ Can I get this to work for a graph in which some of the edges are directed (in which case I'd like to leave them alone)? E.g g = CayleyGraph[DihedralGroup[4]]? $\endgroup$
    – orome
    Commented May 31, 2012 at 19:32
  • $\begingroup$ The error I get for DihedralGroup[4] (or anything with single arrows between nodes) is "VertexCoordinates->{...} at position 2 is not a non-empty square matrix". I get that error even if I substitute the coordinates for AbelianGroup[{2, 2, 2}] (which works on its own) when tying to use the code above for DihedralGroup[4] $\endgroup$
    – orome
    Commented May 31, 2012 at 20:07
  • $\begingroup$ @raxacoricofallapatorius AFAIK, you can't mix UE and DE in a Graph object... $\endgroup$
    – rm -rf
    Commented May 31, 2012 at 20:23
  • $\begingroup$ @R.M: If that's so, is there way a to create what I'm looking for by superposing two graphs: one where all paired DE have been replaced with a UE while unpaired DE are made invisible, and another where the paired DE are made invisible, while the unpaired DE are left alone? (If that's the only way to accomplish what I'm looking for.) $\endgroup$
    – orome
    Commented May 31, 2012 at 20:31
  • $\begingroup$ @raxacoricofallapatorius I updated the code with DirectedEdges -> False option so your problem is fixed now. $\endgroup$ Commented May 31, 2012 at 21:12
7
$\begingroup$

You cannot use both undirected and directed edges (i.e., mixed graph) in a Graph object. However, you can control the edge style and shapes for the multi-edge case separately and get what you want. Here's an example:

g = CayleyGraph[DihedralGroup[4]];

(* Separate the two sets of edges *)
edges1 = EdgeList@(g1 = EdgeDelete[g, DirectedEdge[a_, b_] /; EdgeQ[g, DirectedEdge[b, a]]]);
edges2 = DeleteDuplicates[EdgeList[GraphDifference[g, g1]], #1 === Reverse[#2] &];

(* Style the two graphs and put them together *)
Graph[edges1~Join~edges2, 
    EdgeShapeFunction -> {Thread[edges2 -> "Line"], Thread[edges1 -> "Arrow"]}~Flatten~1,
    EdgeStyle -> {Thread[edges2 -> Red], Thread[edges1 -> Blue]}~Flatten~1, 
    VertexStyle -> Black
]

enter image description here

$\endgroup$
3
  • $\begingroup$ you can also do the stylings and shape in one go with a more detailed edge shape function. Note that the graph is still a directed one... DirectedGraphQ[finalgraph] will give True $\endgroup$
    – rm -rf
    Commented May 31, 2012 at 22:49
  • $\begingroup$ This works great except for groups without DE (e.g. AbelianGroup[{2, 2}]), where it gives weird results. $\endgroup$
    – orome
    Commented May 31, 2012 at 23:10
  • $\begingroup$ It gives the correct result, but the orientation is wonky, because Graph uses an automatic layout that's dependent on the order in which edges are input. You can force it to be something that's useful with GraphLayout -> "SpringEmbedding", or anything else you like. The alternate is to explicitly provide VertexCoordinates... $\endgroup$
    – rm -rf
    Commented Jun 1, 2012 at 0:09
2
$\begingroup$

Version 10 supports graphs with mixed directed and undirected edges.

g = CayleyGraph[DihedralGroup[4]]

newEdges = Flatten[
  GatherBy[EdgeList[g], Sort] /. {{a_  \[DirectedEdge] b_, _} :> {a <-> b}}
]

e = GroupBy[newEdges, Head]

g2 = Graph[newEdges, EdgeStyle -> Catenate[Thread /@ {e[UndirectedEdge] -> Red, e[DirectedEdge] -> Blue}]]

$\endgroup$
3
  • $\begingroup$ Since Wolfram apparently has its own definition of "Launched" (which elsewhere on Earth means "immediately available", at least to highly paying "Premier" — another word for which Wolfram has its own definition — customers), I don't have access to this yet. $\endgroup$
    – orome
    Commented Jul 10, 2014 at 18:13
  • $\begingroup$ @raxacoricofallapatorius I got a new license key in email (my university has a site license), but not a download link. I downloaded the trial version installer (which is said to be identical to the full version installer) and used it with the full version license key. $\endgroup$
    – Szabolcs
    Commented Jul 10, 2014 at 18:17
  • $\begingroup$ Yes, I've been told they're sending out the e-mails in "waves". They just forgot that the "launch" announcement really ought to come after the last wave (at least to "Premier" customers). $\endgroup$
    – orome
    Commented Jul 10, 2014 at 18:36

Your Answer

By clicking “Post Your Answer”, you agree to our terms of service and acknowledge you have read our privacy policy.

Not the answer you're looking for? Browse other questions tagged or ask your own question.