Let's consider the following case
f[x_] := x^2;
data = Table[{x, f[x]}, {x, -10, 10, 0.1}];
p0 = ListPlot[data, Frame -> True, Axes -> False, Joined -> True,
     PlotStyle -> {Blue, Thick}]
In reality my data sets correspond to closed curves (loops), for which however the analytic equation is unknown. So, the solution should not take for granted that we know the exact mathematical expression.
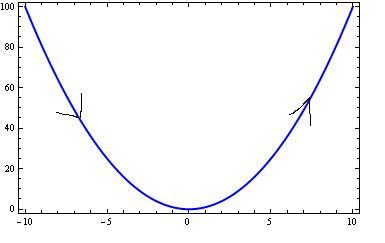
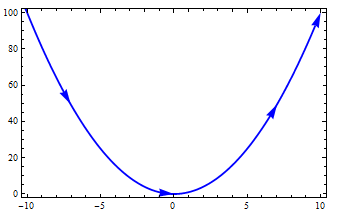
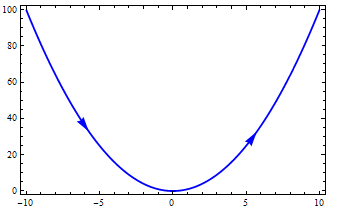
Now I would like to add arrows inside the curve (which is produced by joining the points) thus showing the direction (from left to right), like this

Any suggestions?


