2
$\begingroup$

Hello I am interested in smoothing out the sharp edges of a single rectangular wave centered at the origin.

I am looking for a smooth function that looks almost exactly the same as the square wave except it is differentiable everywhere.

I looked at Fourier Series but this creates a periodic function which I do not want. I want to create a rectangular wave of finite height and zero everywhere else.

Ultimately, I want to plug this approximating function into NDSolve in attempt to get rid of "spiky" effects present in the solution of the wave equation.

Thank You!

Edit::

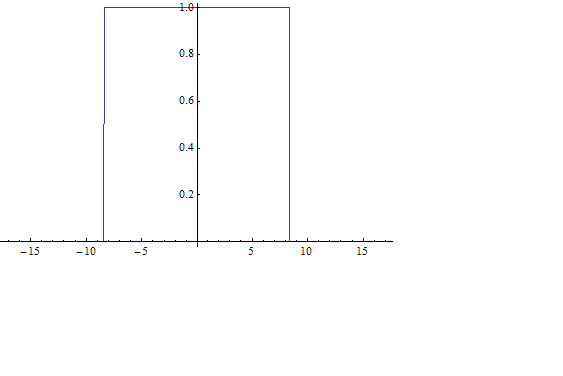
This is the square pulse in question: enter image description here

$\endgroup$
8
  • $\begingroup$ how about the sum of two Tanh? I think the proper parametrization (how steep you make them) needs some information about your problem... $\endgroup$ Commented Sep 27, 2014 at 19:42
  • $\begingroup$ Hello, I edited my post. This is the square wave I would like to approximate using a smooth function. Ultimately, such approximating function will be used as a initial condition to solve the linearly damped wave equation. $\endgroup$ Commented Sep 27, 2014 at 21:36
  • $\begingroup$ Somehow, a graph doesn't seem that precise. Where are the discontinuities? x = -8.5 and x = 8.3? $\endgroup$
    – Michael E2
    Commented Sep 27, 2014 at 22:54
  • $\begingroup$ Hello @MichaelE2, I don't think I phrase my question correctly, I was talking about undifferentiability at the points -8.5 and +8.5. I was trying to smooth this out in order to differentiate it everywhere along the Interpolating Function (I wanted to see if these sharp edges were contributing to fuzzyiness of my interpolating function (mathematica.stackexchange.com/questions/60772/…)). I am currently trying to integrate ub[0.1][x] to find the area of the inital rectangular wave pulse from -infinity to +infinity. $\endgroup$ Commented Sep 28, 2014 at 2:12
  • $\begingroup$ @MicahelE2 But ub[epsilon_] isn't defined everywhere along the x axis. It looks like the interpolating function doesn't define y value of zero everywhere except for inside of the rectangular wave. I tried adding points such as {-200,0}, and {200,0} to extend the domain of my function, but doing this operation doesn't produce a plot. Is there a way to do this? Thank You! $\endgroup$ Commented Sep 28, 2014 at 2:16

1 Answer 1

6
$\begingroup$

For NDSolve, an InterpolatingFunction might be sufficient. Here are smooth versions of UnitStep and UnitBox, with a smoothing "radius" of epsilon.

us[epsilon_] := 
  Interpolation[{{{-epsilon}, 0, 0}, {{epsilon}, 1, 0}}, 
   "ExtrapolationHandler" -> {If[# < -epsilon, 0, 1] &, "WarningMessage" -> False}];
ub[epsilon_] := 
 Interpolation[   
  {{{-1/2 - epsilon}, 0, 0}, {{-1/2 + epsilon}, 1, 0},
   {{1/2 - epsilon}, 1, 0}, {{1/2 + epsilon}, 0, 0}}, 
  "ExtrapolationHandler" -> {0 &, "WarningMessage" -> False}]

Example

sol = NDSolve[{y''[x] + ub[0.1][(x - 6)/6.5] y[x] == 0, y[0] == 1, y'[0] == 0}, y, {x, 0, 15}];
Plot[y[x] /. First[sol], {x, 0, 15}]
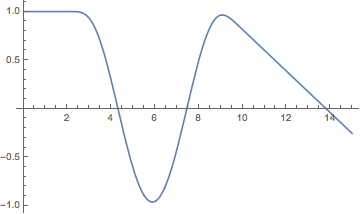
Mathematica graphics

Response to updated question

You could construct an explicit interpolation for your particular use case instead of using the generic functions us and ub. For example, for the updated question, one could replace the ± 1/2 by ± 8.5 in ub, or by arbitrary cutoffs a, b, if a general function is needed, as follows.

smoothbox[a_, b_, epsilon_] /; a < b && epsilon > 0 := Interpolation[{
    {{a - epsilon}, 0, 0}, {{a + epsilon}, 1, 0},
    {{b - epsilon}, 1, 0}, {{b + epsilon}, 0, 0}},
  "ExtrapolationHandler" -> {0 &, "WarningMessage" -> False}]

GraphicsRow@{
  Plot[smoothbox[-8.5, 8.5, 2.5][x], {x, -15, 15}],
  Plot[smoothbox[-8.5, 8.5, 2.5][x], {x, 5, 12}]}

Mathematica graphics

$\endgroup$

Your Answer

By clicking “Post Your Answer”, you agree to our terms of service and acknowledge you have read our privacy policy.

Not the answer you're looking for? Browse other questions tagged or ask your own question.