5
$\begingroup$

Recently installed the new version but I can't get the graphics to look the way I want them to. If I run this code

Plot[x^2, {x, -5, 5}, PlotStyle -> Thick]

in version 8.0 I get this:
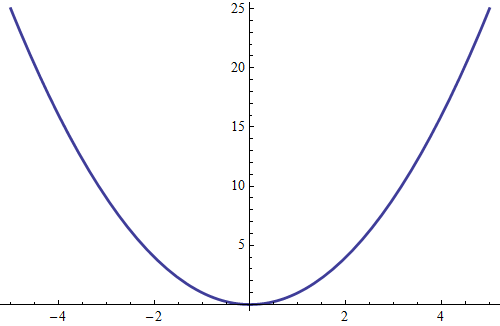
enter image description here

But if I run the same code in version 10.0 I get this:
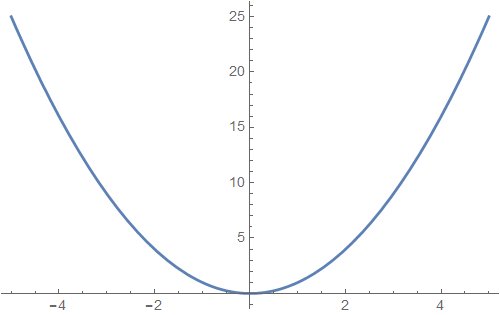
enter image description here

(I exported the images using the Export command to post them here, but the issue is present in the notebook as well - they look exactly like this when plotted)

The blue trace looks better, in my opinion, in the older version. It's more vibrant, less faded or washed out. This also applies to the numbers on the axes, which look gray in the version 10.0 plot but black in the version 8.0 plot.

How can I reproduce the old graphics? Why did they make this change? Maybe the newer version is better for the screen, but I am trying to make publication-quality plots and need the old style.

$\endgroup$
6
  • 1
    $\begingroup$ How exactly did you export? Interactively or programmatically? Please provide info or code. $\endgroup$
    – Yves Klett
    Commented Sep 9, 2014 at 8:40
  • $\begingroup$ Always with Export. I've never once found that interactive prompt within the notebook to be useful. Do you know how to disable it? $\endgroup$
    – Jason B.
    Commented Sep 9, 2014 at 8:44
  • 5
    $\begingroup$ PlotTheme - > "Classic"? reference.wolfram.com/language/ref/PlotTheme.html $\endgroup$ Commented Sep 9, 2014 at 8:49
  • 1
    $\begingroup$ Based on the updated plot themes that came with MMA10: wolfram.com/mathematica/new-in-10/plot-themes $\endgroup$ Commented Sep 9, 2014 at 8:50
  • $\begingroup$ Thanks @blochwave, that fixed it! (also, answered my own question about disabling the suggestion bar, in the preferences menu) $\endgroup$
    – Jason B.
    Commented Sep 9, 2014 at 8:51

1 Answer 1

8
$\begingroup$

You can change the default setting for the option PlotTheme for graphics functions with $PlotTheme.

$PlotTheme = "Classic"

or make that change only locally

Block[{$PlotTheme = "Classic"},Plot[x^2, {x, -5, 5}, PlotStyle -> Thick]]

or more simply by specifying it as an option

Plot[x^2, {x, -5, 5}, PlotStyle -> Thick,PlotTheme - > "Classic"]

as explained by @blochwave in the comments.

$\endgroup$

Your Answer

By clicking “Post Your Answer”, you agree to our terms of service and acknowledge you have read our privacy policy.

Not the answer you're looking for? Browse other questions tagged or ask your own question.