7
$\begingroup$

I would like to ask your advice how to speed up Contour and Parametric plots in the following example.

Let as start by defining a function

A = {(8 Sqrt[1035741])/15625, 0, 0, 0, 0, Sqrt[6597877/15]/6250, 0, 0, 0, 
0, -(Sqrt[(6338501/10)]/3125), 0, 0, 0, 0, (29 Sqrt[27347/30])/3125, 0, 0, 
0, 0, -(Sqrt[(4358874/5)]/3125), 0, 0, 0, 0, -(Sqrt[(352454081/3)]/31250), 
0, 0, 0};
Clear[s]
s[m_, l_] := If[m < 0, (-1)^m s[-m, l]]
s[m_?NonNegative, l_] := If[Abs[m] <= l, A[[m + 1]], 0]
Clear[ysaf]
L = 28;
ysaf[θ_, ϕ_] = 
ExpToTrig[Sum[s[m, L] SphericalHarmonicY[L, m, θ, ϕ], {m, -5 IntegerPart[L/5], L, 5}]];

ysaf is a pretty complicated trigonometric function of two angles in spherical coordinate system.

Next, we define a few parameters for a stereographic projection. I am plotting a part of the unit sphere as seen from a point on z-axis.

θmx = ArcCos[1/Sqrt[5]];
λ = 3/4;
rmx = Sin[θmx/λ];

Following plot takes a minute or so

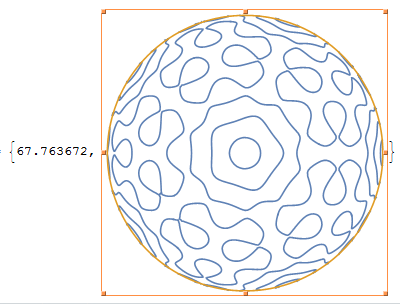
gr = ContourPlot[{ysaf[λ ArcSin[Sqrt[x^2 + y^2]] , ArcTan[x, y]] == 0,
Sqrt[x^2 + y^2] == rmx}, {x, -rmx, rmx}, {y, -rmx, rmx}, 
RegionFunction -> Function[{x, y, z}, Sqrt[x^2 + y^2] <= rmx], 
Axes -> False, Frame -> False]

Next, I am constructing interpolating functions for contour lines (like in this post)

lines = Cases[Normal[gr], Line[i__] -> i, Infinity];
fns = Map[Map[ListInterpolation[#, {{0, 1}}] &, Transpose[#]] &, lines];

and define a Schwarz-Christoffel map (see p. 468 of Complex Analysis with MATHEMATICA® by W. T. Shaw, isbn 0521836263):

PolyMap[z_] = Integrate[1/(1 - ξ^5)^(2/5), {ξ, 0, z}];

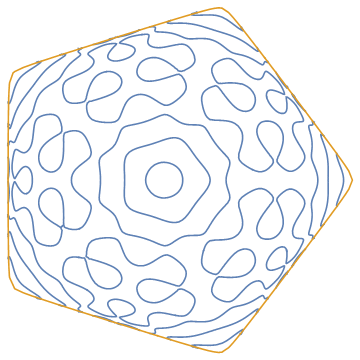
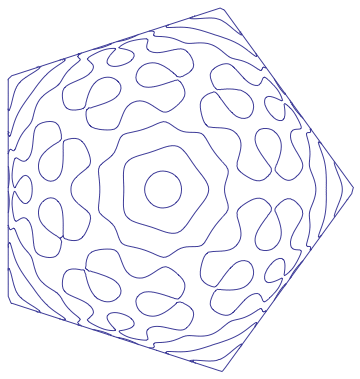
This final plot is the objective of my question. How can I speed it up?

ParametricPlot[
Table[PolyMap[(Through[fns[[a]][x]]/rmx) /. {List -> Complex}] /. 
Complex[i_, j_] :> {i, j}, {a, 1, First[Dimensions[fns]]}], {x, 0, 1}, Axes -> False, Frame -> False]
plot1

plot2

Any help is appreciated!

$\endgroup$
2
  • $\begingroup$ Extremely nice plots. Despite some efforts I couldn't make them faster. Will try tomorrow again. $\endgroup$
    – eldo
    Commented Aug 29, 2014 at 22:05
  • $\begingroup$ @eldo Thanks a lot for comments! $\endgroup$
    – yarchik
    Commented Sep 1, 2014 at 8:07

4 Answers 4

5
$\begingroup$

You can get a significant boost by compiling ysaf:

ysafc = Compile[{x, y}, Evaluate @ N @ ysaf[λ ArcSin[Sqrt[x^2 + y^2]], ArcTan[x, y]]];

func[x_?NumericQ, y_?NumericQ] := ysafc[x, y]

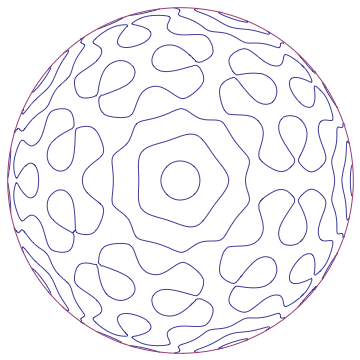
gr = ContourPlot[{func[x, y] == 0, Sqrt[x^2 + y^2] == rmx}, {x, -rmx, rmx}, {y, -rmx, rmx}, 
  RegionFunction -> Function[{x, y, z}, Sqrt[x^2 + y^2] <= rmx], 
  Axes -> False, Frame -> False]

For the mapping I would suggest transforming the coordinate data in gr directly. I have also used GenerateConditions -> False in the integral to remove the ConditionalExpression:

PolyMap[z_] = Integrate[1/(1 - ξ^5)^(2/5), {ξ, 0, z}, GenerateConditions -> False];

pm[{x_, y_}] := Through[{Re, Im} @ PolyMap[x + I y]]

Show[Normal[gr] /. Line[data_] :> Line[pm /@ data], PlotRange -> All]

enter image description here

$\endgroup$
2
  • $\begingroup$ I learnt a lot from your answer. Even though your code was not the fastest for the ContourPlot I am accepting this answer because it gives an incredible boost was the second part -the Schwarz-Cristoffel transform. This was the slowest part of the code and now it runs in less than 1 sec! $\endgroup$
    – yarchik
    Commented Sep 1, 2014 at 8:11
  • 1
    $\begingroup$ Even easier: PolyMap[z_] = Integrate[1/(1 - z^5)^(2/5), z]. $\endgroup$ Commented Oct 18, 2015 at 19:00
4
$\begingroup$

Some codes are from the answer of PhilChang

Remove["Global`*"];
A = {(8 Sqrt[1035741])/15625, 0, 0, 0, 0, Sqrt[6597877/15]/6250, 0, 0,
     0, 0, -(Sqrt[(6338501/10)]/3125), 0, 0, 0, 0, (29 Sqrt[27347/30])/3125, 0, 0, 0, 
    0, -(Sqrt[(4358874/5)]/3125), 0, 0, 0, 0, -(Sqrt[(352454081/3)]/31250), 0, 0, 0} // N;
s[m_, l_] := If[Abs[m] > l, 0, If[Negative[m], (-1)^m A[[(-m) + 1]], A[[m + 1]]]]
L = 28;
mlist = Table[m, {m, -5 IntegerPart[L/5], L, 5}];
slist = s[#, L] & /@ mlist;
ysaf[θ_, ϕ_] = Dot[s[#, L] & /@ mlist, SphericalHarmonicY[L, mlist, θ, ϕ]];
θmx = ArcCos[1.0/Sqrt[5.0]];
λ = 3.0/4.0;
rmx = Sin[θmx/λ];

ysafNew = 
 Compile[{{x, _Real}, {y, _Real}}, 
  Evaluate@With[{θ = λ ArcSin[
        Sqrt[x^2 + y^2]], ϕ = ArcTan[x, y]}, 
    Re@Dot[slist, SphericalHarmonicY[L, mlist, θ, ϕ]]]];

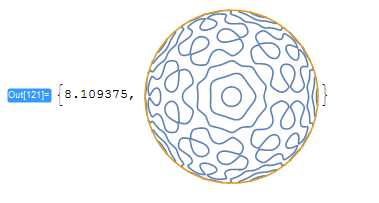
ContourPlot[{ysafNew[x, y] == 0.0, Sqrt[x^2 + y^2] == rmx}, {x, -rmx, 
    rmx}, {y, -rmx, rmx}, 
   RegionFunction -> Function[{x, y, z}, Sqrt[x^2 + y^2] <= rmx], 
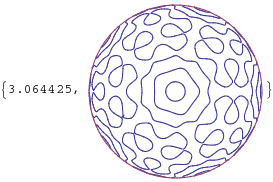
   Axes -> False, Frame -> False] // Quiet // AbsoluteTiming

Mathematica graphics

$\endgroup$
2
  • $\begingroup$ hi,do you know how to optimize fns and ParametricPlot? i can not understand what it means $\endgroup$
    – PhilChang
    Commented Aug 30, 2014 at 9:45
  • $\begingroup$ @ Chenminqi When I tried your solution on my machine I got incredible 1.4 sec! Combining your answer with the solution of @Simon Woods for the Schwarz-Cristoffel mapping I am getting 1.4 + 0.8 sec in total! $\endgroup$
    – yarchik
    Commented Sep 1, 2014 at 8:20
4
$\begingroup$

One can gain a considerable speed gain by omitting RegionFunction and setting PlotPoints to 10. The following only needs 8 seconds (it uses some ideas of @PhilChang):

A = {
   (8 Sqrt[1035741])/15625, 0, 0, 0, 0,
   Sqrt[6597877/15]/6250, 0, 0, 0, 0,
   -(Sqrt[(6338501/10)]/3125), 0, 0, 0, 0,
   (29 Sqrt[27347/30])/3125, 0, 0, 0, 0,
   -(Sqrt[(4358874/5)]/3125), 0, 0, 0, 0,
   -(Sqrt[(352454081/3)]/31250), 0, 0, 0
   };

s[m_, l_] := If[Abs[m] > l, 0, If[Negative[m], (-1)^m A[[(-m) + 1]], A[[m + 1]]]]

L = 16;
mx = ArcCos[1/Sqrt[5]];
lambda = 3/4;
rmx = Sin[mx/lambda];
mlist = Table[m, {m, -5 IntegerPart[L/5], L, 5}];
slist = s[#, L] & /@ mlist;
hlist = SphericalHarmonicY[L, #, a, b] & /@ mlist;

ysaf[a_, b_] = Dot[slist, hlist];

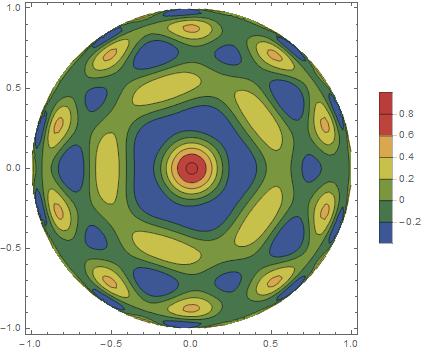
ContourPlot[
  ysaf[lambda ArcSin[Sqrt[x^2 + y^2]], ArcTan[x, y]],
  {x, -rmx, rmx}, {y, -rmx, rmx},
  ColorFunction -> "DarkRainbow",
  Contours -> 6,
  PlotPoints -> 10,
  PlotLegends -> Automatic]

enter image description here

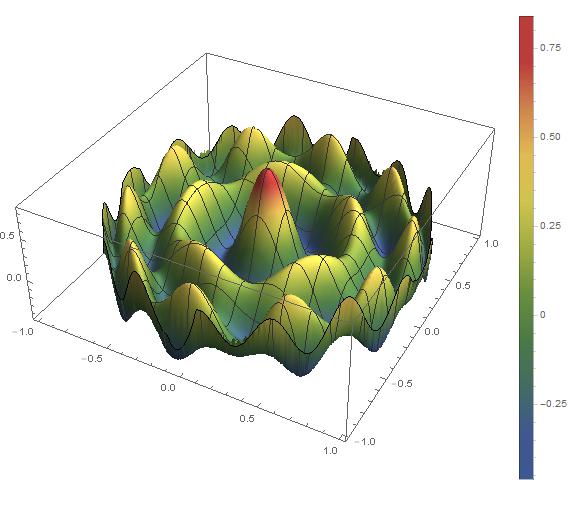
Plot3D[
  ysaf[lambda ArcSin[Sqrt[x^2 + y^2]], ArcTan[x, y]],
  {x, -rmx, rmx}, {y, -rmx, rmx},
  ColorFunction -> "DarkRainbow",
  PlotPoints -> 50,
  ImageSize -> 500,
  PlotLegends -> Automatic]

enter image description here

$\endgroup$
4
$\begingroup$

The orginal program takes 78s on my computer. First, Make vector A a real vector will make the program a little faster.

 A = {(8 Sqrt[1035741])/15625, 0, 0, 0, 0, Sqrt[6597877/15]/6250, 0, 0,
     0, 0, -(Sqrt[(6338501/10)]/3125), 0, 0, 0, 
    0, (29 Sqrt[27347/30])/3125, 0, 0, 0, 
    0, -(Sqrt[(4358874/5)]/3125), 0, 0, 0, 
    0, -(Sqrt[(352454081/3)]/31250), 0, 0, 0} // N;

Second, avoiding recursive in function s also help.

s[m_, l_] := If[Abs[m] > l, 0,
    If[Negative[m], (-1)^m A[[(-m) + 1]], A[[m + 1]] ]

Third, Sum is a little bit slow. Use Dot instead. And ExpToTrig is not necessary.

mlist = Table[m, {m, -5 IntegerPart[L/5], L, 5}];
ysaf[θ_, ϕ_] = 

   Dot[s[#, L] & /@ mlist, 
    SphericalHarmonicY[L, #, θ, ϕ] & /@ mlist];

Fourth,Evaluate

gr = ContourPlot[
  Evaluate@{  
    ysaf[λ ArcSin[Sqrt[x^2 + y^2]], ArcTan[x, y]] == 0.0, 
    Sqrt[x^2 + y^2] == rmx}, {x, -rmx, rmx}, {y, -rmx, rmx}, 
  RegionFunction -> Function[{x, y, z}, Sqrt[x^2 + y^2] <= rmx], 
  Axes -> False, Frame -> False]

In this way, the contour plot gr cost 20s compared with original 78s on my computer.

Besides, if you define your function ysaf as

ysafNew[x_, y_] := 
 With[{  θ = λ ArcSin[Sqrt[x^2 + y^2]], ϕ = 
    ArcTan[x, y]},
                Re@Dot[slist, SphericalHarmonicY[L, mlist, θ, ϕ]]

the time will be 9s.

I hope someone could improve more.

In ParametricPlot, Use MaxRecursion and Plotpoints

ParametricPlot[
Table[PolyMap[(Through[fns[[a]][x]]/rmx) /. {List -> Complex}] /. 
Complex[i_, j_] :> {i, j}, {a, 1, First[Dimensions[fns]]}],
{x, 0, 1}, Axes -> False, Frame -> False, 
MaxRecursion -> 2, 
PlotPoints -> 30]

============================================================================================== Here is all the code:

    Remove["Global`*"];
A = {(8 Sqrt[1035741])/15625, 0, 0, 0, 0, Sqrt[6597877/15]/6250, 0, 0,
     0, 0, -(Sqrt[(6338501/10)]/3125), 0, 0, 0, 
    0, (29 Sqrt[27347/30])/3125, 0, 0, 0, 
    0, -(Sqrt[(4358874/5)]/3125), 0, 0, 0, 
    0, -(Sqrt[(352454081/3)]/31250), 0, 0, 0} // N;
Clear[s]
(*s[m_,l_]:=If[m<0,(-1)^m s[-m,l]]
s[m_?NonNegative,l_]:=If[Abs[m]≤l,A[[m+1]],0]*)
s[m_, l_] := If[Abs[m] > l, 0,
    If[Negative[m], (-1)^m A[[(-m) + 1]], A[[m + 1]] ]
  ]
Clear[ysaf]
L = 28;
(*ysaf[θ_,ϕ_]=ExpToTrig[Sum[s[m,L] \
SphericalHarmonicY[L,m,θ,ϕ],{m,-5 \
IntegerPart[L/5],L,5}]];*)
mlist = Table[m, {m, -5 IntegerPart[L/5], L, 5}];
slist = s[#, L] & /@ mlist; 
ysaf[θ_, ϕ_] = 
  Dot[s[#, L] & /@ mlist, 
   SphericalHarmonicY[L, mlist, θ, ϕ]] ;
θmx = ArcCos[1.0/Sqrt[5.0]];
λ = 3.0/4.0;
rmx = Sin[θmx/λ];
ysafNew[x_, y_] := 
  With[{  θ = λ ArcSin[Sqrt[x^2 + y^2]], ϕ = 
     ArcTan[x, y]},
                Re@Dot[slist, SphericalHarmonicY[L, mlist, θ, ϕ]]
        ];
{time, gr} = 
 ContourPlot[
   Evaluate@{ysafNew[x, y] == 0.0, Sqrt[x^2 + y^2] == rmx}, {x, -rmx, 
    rmx}, {y, -rmx, rmx}, 
   RegionFunction -> Function[{x, y, z}, Sqrt[x^2 + y^2] <= rmx], 
   Axes -> False, Frame -> False] // AbsoluteTiming

enter image description here enter image description here

$\endgroup$
2
  • $\begingroup$ Aside from the fact that your answer contains several typos I cannot confirm at all your timings. Any proof? $\endgroup$
    – eldo
    Commented Aug 30, 2014 at 8:20
  • $\begingroup$ @eldo, I pasted all my source code in my answer, if you can not run the code, please let me know. I did not understand how to get fns and the function inside the ParametricPlot very much, so I can not optimize the performance. $\endgroup$
    – PhilChang
    Commented Aug 30, 2014 at 8:47

Your Answer

By clicking “Post Your Answer”, you agree to our terms of service and acknowledge you have read our privacy policy.

Not the answer you're looking for? Browse other questions tagged or ask your own question.