8
$\begingroup$

Is it possible to have ListPolarPlot start plotting at the vertical axis? By Default ListPolarPlot gives this result:

ListPolarPlot[Reverse[Range[20]], PolarAxes -> True, 
 PolarTicks -> {"Degrees", Automatic}]
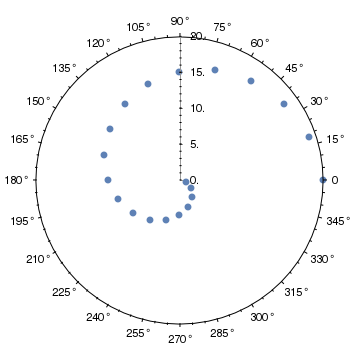
enter image description here

But I want it to look like this (rotated with Rotate[%,1/2pi]: enter image description here
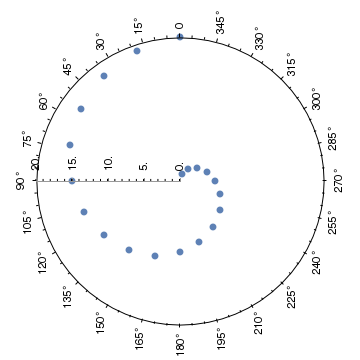
Just rotating the graphic probably is the easiest way, but adding ticks and legends is a crime... I am hoping for a way to simply set the starting angle.

Specifying angles at each data point and adding 1/2pi does not solve my problem because the angles in the PolarAxes would be off.

$\endgroup$
0

1 Answer 1

10
$\begingroup$

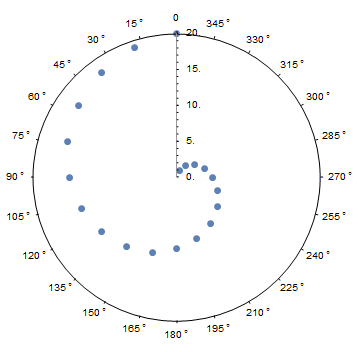
Make rotate transform like this. And change some options of ListPolarPlot. I modified the PolarTicks option.

rotatePolar[a_List] := Module[{l = Length[a]},
  Table[{2 Pi*(i - 1)/l + Pi/2, a[[i]]}, {i, l}]
  ]

ListPolarPlot[rotatePolar[Reverse[Range[20]]], PolarAxes -> True,
 PolarAxesOrigin -> {Pi/2, 20},
 PolarTicks -> {Drop[
    Table[{i, Mod[i - 90 Degree, 360 Degree]}, {i, 0, 360 Degree, 
      15 Degree}], -1], Automatic}
 ]

enter image description here

$\endgroup$
1
  • $\begingroup$ Ah, the trick with the PolarTicks is very clever! :) Thanks a lot. $\endgroup$ Commented Aug 27, 2014 at 19:14

Your Answer

By clicking “Post Your Answer”, you agree to our terms of service and acknowledge you have read our privacy policy.

Not the answer you're looking for? Browse other questions tagged or ask your own question.