5
$\begingroup$

I am working with data that contains missing values (I have several variables (across the columns) and several observations (across the rows) in an excel spreadsheet).

Example of the data structure:

obs var1 var2 ... var30
1    100  1
2    .    0
3    30   1
4.   20   .
...

After importing the data:

names = Import["Example_Data.xls", {"Data", 1, 1}];

data = Drop[Import["Example_Data.xls", {"Data", 1}], 1]

I want to create a simple correlation table:

corrm = Correlation[data] //MatrixForm

Questions:

  1. How can I calculate the Correlation here given that I have missing data?

  2. More generally, how do I work with missing data in mathematica? I have previously worked with Stata where missing values are taken care of under the hood. With that said, will I get the same correlation values here if I simply remove the missing values as I would if I tried to calculate the correlation using a statistical package such as e.g. Stata?

[EDIT] For question #2 above I found the following entry useful (http://www.ats.ucla.edu/stat/stata/output/stata_corr_output.htm). It seems that the standard procedure for statistical programs such as Stata is to delete each observation containing a missing value for one or more of its variables. As such, I would appreciate a method for answering question #1 using a similar method.

NOTE: After a preliminary search I found the following resources helpful (but they did not answer my questions): http://mathematica.stackexchange.com/questions/29159/correlation-with-missing-data http://reference.wolfram.com/language/howto/ReplaceOrRemoveInvalidOrMissingData.html

$\endgroup$
1
  • $\begingroup$ have you thought about the consequences of removing data? does this affect the answer to the question your were using statical methods to find an answer for? $\endgroup$
    – Rho Phi
    Commented May 26, 2017 at 10:12

3 Answers 3

3
$\begingroup$

Hopefully I don't misunderstand but I think this will be of help:

SeedRandom[0]
d1 = {Range[#], RandomInteger[99, #], RandomInteger[1, #]}\[Transpose] &[20]
{{1, 83, 1}, {2, 66, 1}, {3, 4, 0}, {4, 21, 0}, {5, 71, 0}, {6, 67, 1}, {7, 16, 1}, {8, 
  67, 0}, {9, 76, 1}, {10, 28, 1}, {11, 21, 1}, {12, 43, 1}, {13, 17, 0}, {14, 46, 
  0}, {15, 53, 0}, {16, 84, 0}, {17, 85, 0}, {18, 17, 0}, {19, 50, 0}, {20, 15, 0}}
d2 = ReplacePart[d1, {{4, 2}, {7, 2}, {18, 2}, {3, 3}, {14, 3}} -> Missing[]]
{{1, 83, 1}, {2, 66, 1}, {3, 4, Missing[]}, {4, Missing[], 0}, {5, 71, 0}, {6, 67, 1}, {7,
   Missing[], 1}, {8, 67, 0}, {9, 76, 1}, {10, 28, 1}, {11, 21, 1}, {12, 43, 1}, {13, 17, 
  0}, {14, 46, Missing[]}, {15, 53, 0}, {16, 84, 0}, {17, 85, 0}, {18, Missing[], 0}, {19,
   50, 0}, {20, 15, 0}}
d3 = DeleteCases[d2, {___, _Missing, ___}]
{{1, 83, 1}, {2, 66, 1}, {5, 71, 0}, {6, 67, 1}, {8, 67, 0}, {9, 76, 1}, {10, 28, 1}, {11,
   21, 1}, {12, 43, 1}, {13, 17, 0}, {15, 53, 0}, {16, 84, 0}, {17, 85, 0}, {19, 50, 
  0}, {20, 15, 0}}
Correlation[d3] // N // MatrixForm

$\left( \begin{array}{ccc} 1. & -0.368582 & -0.601334 \\ -0.368582 & 1. & -0.00812275 \\ -0.601334 & -0.00812275 & 1. \\ \end{array} \right)$

$\endgroup$
1
  • $\begingroup$ Never mind previous comment, I see that is what is specified in the Stata page. $\endgroup$
    – mfvonh
    Commented Aug 25, 2014 at 14:41
8
$\begingroup$

Take a look at this. Let's generate some data with missing entries:

data = Table[9 k + RandomInteger[9, 10], {k, 10}] /. 
   Thread[RandomInteger[99, 5] -> Missing[]];
data // TableForm

enter image description here

Build TemporalData object and select replacement method for missing points:

td = TemporalData[data, {Range[10]}, 
  MissingDataMethod -> {"Interpolation", InterpolationOrder -> 2}];

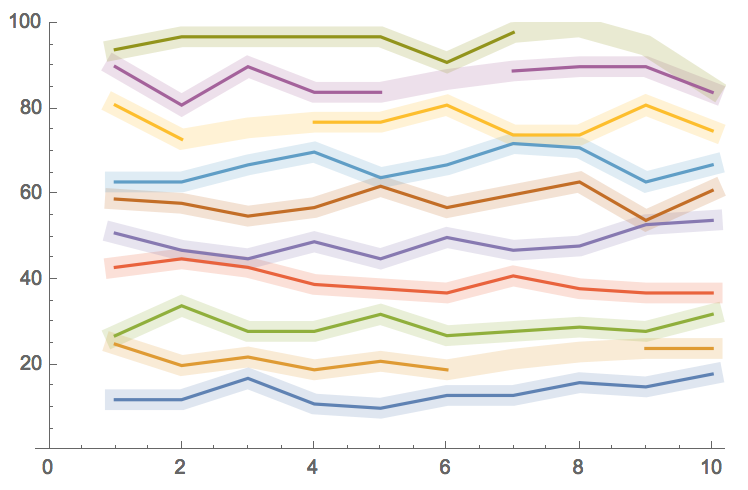
See healed data:

Overlay[{
  ListLinePlot[td, 
   PlotStyle -> Directive[Opacity[.2], Thickness[.03]], 
   PlotRange -> {0, 100}],
  ListLinePlot[data, PlotRange -> {0, 100}]
  }]

enter image description here

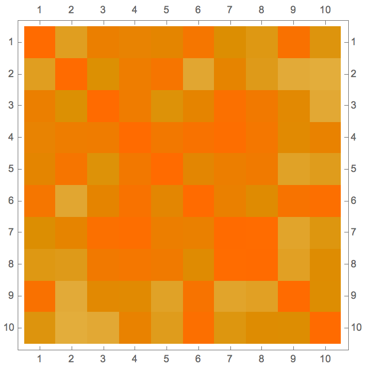
Compute correlation:

Correlation[td["Values", All]] // N // MatrixPlot

enter image description here

$\endgroup$
1
  • $\begingroup$ Nice example Vitaliy. It seems that your approach to the problem is to "fill in the gaps", i.e. to replace the missing values using synthetic (interpolated) data. That will, however, not work in my case since for some of the variables I have a lot of missing data, so imputing values where they are missing will not work. Rather I want to keep as much of them as possible in order to use their information, but if not possible I will need to delete them. $\endgroup$
    – Seb
    Commented Aug 24, 2014 at 22:32
2
$\begingroup$

As you requested in your edit, @Mr.Wizard's answer shows how to perform listwise deletion (= corr in Stata). An alternative is to perform pairwise deletion (= pwcorr). In a comment above you note that some variables have many missing values; in my opinion this indicates you may want to consider pairwise deletion so that you are not throwing out a lot of useful observations, unless of course there is a particular reason not to do so. There are tradeoffs between the methods, but depending on your data one or the other may perform considerably better. See this review for more details. Pairwise deletion can be implemented like this:

SeedRandom@8675309;
data = Table[9 k + RandomInteger[9, 10], {k, 10}] /. 
   Thread[RandomInteger[99, 5] -> Missing[]];
ArrayReshape[
  Correlation @@@ 
   Transpose /@ 
    DeleteCases[Thread /@ Tuples[data, {2}], 
     x_ /; MemberQ[x, _Missing], {2}], Dimensions@data] // ArrayPlot

enter image description here

$\endgroup$

Your Answer

By clicking “Post Your Answer”, you agree to our terms of service and acknowledge you have read our privacy policy.

Not the answer you're looking for? Browse other questions tagged or ask your own question.