13
$\begingroup$

By combining the state data from here and the extrusion code from here I have managed to make prisms of the various US states such as

enter image description here

However, the extrusion method looses information about the states relative position so I cant reassemble them into a map of the US states which is my final goal: a map with states projected upward by different amounts corresponding to a parameter I have (something like population or total sales) to make a 3D histogram of sorts. I have the seen the last example here(How to Plot Prism in Graphics3D) which has the right geometry but is not at a level of quality I can use in my work. Moreover, the final infographic may have additional data on the state surfaces like colored points indicating hotsopts so that solution wont extend.

$\endgroup$
2
  • $\begingroup$ Have you tried getting the data from here: EntityValue[Entity["AdministrativeDivision", {"Florida", "UnitedStates"}], "Polygon"], rather than the old CountryData? $\endgroup$
    – Carlo
    Commented Aug 21, 2014 at 18:44
  • $\begingroup$ yes, I still end up with the same problem, namely that that coordinate data gets lost once I use the extrusion method. One solution might be to plot a surface where the states have different heights(z-coords) and then fill down but I dont know how to create that surface either. Perhaps if we had an InteriorQ[pt,poly] function? $\endgroup$
    – sonright
    Commented Aug 21, 2014 at 18:59

2 Answers 2

16
$\begingroup$

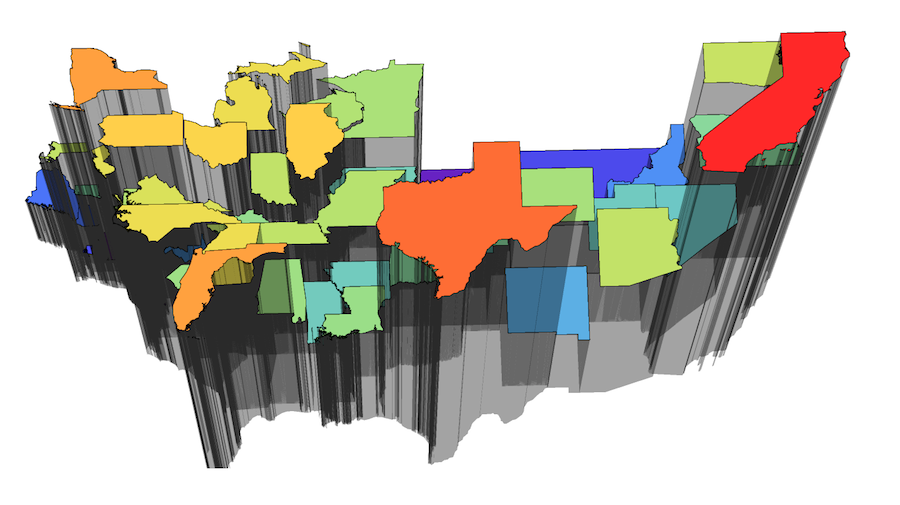
Here is a bit clumsy (had very little time) approach виа combination of new functionality Entity and regions.

(* get the states *)
divisions = 
  EntityValue[Entity["AdministrativeDivision", {_, "UnitedStates"}], 
   "Entities"];

(* get polygons of borders *)
dat = EntityValue[
    divisions, {"Population", "Polygon"}] /. {GeoPosition -> Identity,
     Quantity[x_, _] -> x};

(* some arbitrary rescaling to improve relative height perception *)
pop = Rescale[(# - Min[#]) &@Log[dat[[All, 1]]] // N];

(* plot constants of population of regions of polygons *)
polygs = Plot3D[#1, {x, y} \[Element] #2, Mesh -> None, Filling -> 0, 
     ColorFunction -> "Rainbow", ColorFunctionScaling -> False] & @@@ 
   Transpose[{pop, dat[[All, 2]]}];

(* combine all *)
Show[polygs, PlotRange -> {{23, 50}, {-60, -130}, All}, 
 BoxRatios -> {27, 70, 50}, ImageSize -> 800, Boxed -> False, 
 Axes -> False]

enter image description here

enter image description here

$\endgroup$
6
  • 5
    $\begingroup$ The fact that this map is east-west reversed gives me a headache! $\endgroup$
    – evanb
    Commented Aug 21, 2014 at 22:22
  • 11
    $\begingroup$ This is a nice solution, but the result shows why this kind of presentation obsfucates information rather than revealing it. If Edward Tufte weren't still alive, he'd be spinning in his grave! $\endgroup$
    – Verbeia
    Commented Aug 22, 2014 at 1:05
  • 3
    $\begingroup$ Could you revise your answer to orient the USA correctly? $\endgroup$
    – m_goldberg
    Commented Aug 22, 2014 at 1:07
  • $\begingroup$ Take the final image and reverse by ImageRotate[ImageReflect[image], Pi] $\endgroup$
    – bill s
    Commented Aug 22, 2014 at 14:56
  • $\begingroup$ TO ALL sorry folks, I am a bit out of time. Please feel free to edit post to flip the map - just mark it as an update and keep the original. Thanks everyone! $\endgroup$ Commented Aug 22, 2014 at 16:31
13
$\begingroup$

Here's another approach :

(* divide polygon pts to clean up artificials when polygon has holes *)
FindContourBreaks[pts_List] := 
  Module[{i, lines, breaks = {}}, 
   lines = {pts[[#[[1]]]], pts[[#[[2]]]]} & /@ 
     Partition[RotateLeft[Flatten[{#, #} & /@ Range[Length[pts]], 1]],
       2];
   Position[lines, 
     Alternatives @@ 
      Intersection[{lines[[All, 2]], lines[[All, 1]]} // Transpose, 
       lines]] // Flatten
   ];

FindContourBreak[pts_List] := 
  Module[{breaks, ranges}, breaks = FindContourBreaks[pts];
   ranges = 
    Partition[
     RotateLeft[Join[{1, 1}, Flatten[{#, # + 1} & /@ breaks]]], 2];
   ranges = Drop[ranges, -1];
   DeleteCases[Range @@@ ranges, x_ /; Length[x] < 3]];

(*generate side polygons - heights *)
SideComplex[pts_List, length_] := 
  Module[{topPts, botPts, sideRects, sidePts, sideNormals},
   topPts = pts;
   botPts = (2 length + 1 - #) & /@ topPts;
   sideRects = 
    Partition[
     RotateLeft[Flatten[{#, #} & /@ Range[Length[topPts]], 1]], 2];
   sidePts = {topPts[[#[[1]]]], botPts[[#[[1]]]], botPts[[#[[2]]]], 
       topPts[[#[[2]]]]} & /@ sideRects;
   Polygon@sidePts];

(* main code - it create top, bottom, and side polygons *)
To3DComplex[Polygon[list_], depth_: 10] := To3DComplex[list, depth]

To3DComplex[list_List, depth_: 10] /; (Depth[list] == 3) := 
 Module[{topPts, botPts, length, contours, sidePolys},
  topPts = {#[[1]], #[[2]], depth} & /@ list;
  botPts = Reverse[{#[[1]], #[[2]], 0} & /@ topPts];
  length = Length[list];
  contours = FindContourBreak[list];
  sidePolys = SideComplex[#, length] & /@ contours;
  GraphicsComplex[
   Join[topPts, botPts], {Polygon[Range[length]], 
    Polygon[Range[length + 1, 2 length] // Reverse], EdgeForm[], 
    sidePolys}]
  ]

To3DComplex[list_List, depth_: 10] := To3DComplex[#, depth] & /@ list

Here's example:

(* states except Alaska and Hawaii *)
 divisions = 
 EntityValue[
  Entity["AdministrativeDivision", {Except["Alaska" | "Hawaii"], 
    "UnitedStates"}], "Entities"];

project geoposition to mercator :

dat = (EntityValue[divisions, {"Population", "Polygon"}] /. 
      GeoPosition[x_] :> 
       GeoGridPosition[GeoPosition[x], "Mercator"]) /. 
    GeoGridPosition[x_, "Mercator"] :> x /. Quantity[x_, _] :> x;

rescale population for color function and depth:

pop = Rescale[(# - Min[#]) &@Log[dat[[All, 1]]] // N];

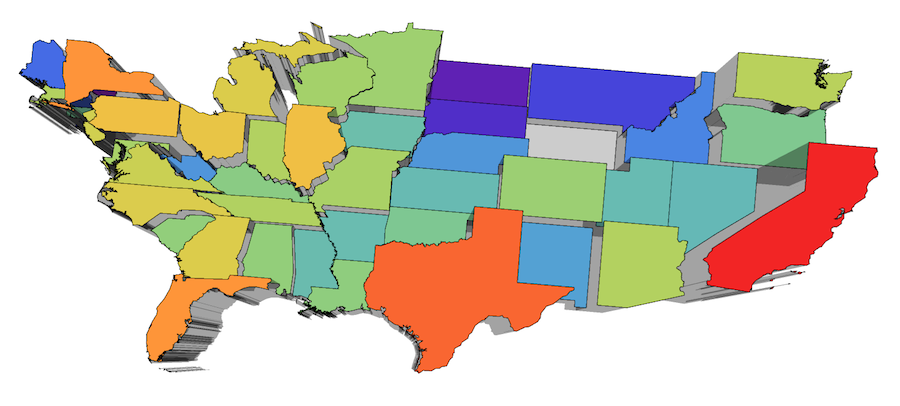
final result (I multiply 20 for depth):

poly = {ColorData["Rainbow"][#1], To3DComplex[#2, 20 #1]} & @@@ 
   Transpose[{pop, dat[[All, 2]]}];

Graphics3D[poly, ImageSize -> 800, Boxed -> False]

enter image description here

$\endgroup$
2
  • $\begingroup$ Hi Halmir, I like your solution and am trying to get it work at the country level, for African and European countries. Unfortunately, while ToComplex3D creates the top and bottom polygons, I don't get any side polygons and can't figure out why. In both cases (Africa & Europe) I just get two sets of countries floating above each other. Any suggestions would be appreciated. Thanks! $\endgroup$
    – Paul Clip
    Commented Jul 18, 2017 at 5:13
  • $\begingroup$ I think it may be an issue with the coordinate space and FindContourBreaks. Europe & Africa both span the Greenwich meridian, and Africa spans the Equator too. Maybe translating the continents so lat / lon are uniformly of the same sign is what's needed? $\endgroup$
    – Paul Clip
    Commented Jul 18, 2017 at 5:37

Your Answer

By clicking “Post Your Answer”, you agree to our terms of service and acknowledge you have read our privacy policy.

Not the answer you're looking for? Browse other questions tagged or ask your own question.