1
$\begingroup$

I have a data list where the elements have the form (time, velocity ). I need to remove some malformed elements in places where the data does not change smoothly and then replace those points by interpolating the elements before and after them.

Here is an example of my data:

{{27.342, -0.01}, {27.443, -0.03}, {27.546, -0.01}, {27.743, -0.01}, {27.945, -0.01}, 
 {28.145, -0.03}, {28.246, -0.05}, {28.346, -0.06}, {28.547, -0.01}, {28.747, -0.01}, 
 {29.149, -0.01}, {29.249, 0}, {29.45, -0.01}, {29.651, -0.05}, {29.852, -0.05}, 
 {30.053, -0.01}, {30.153, -0.01}}

For instance the 7th and 8th elements are malformed since the wind cannot change from -0.3 to -0.05 and -0.6 and then back to -0.01 in 0.1 sec0, so I want to replace them with -0.03 and -0.02.

$\endgroup$
15
  • 1
    $\begingroup$ @farzane How about providing the condition to keep/substitute them? $\endgroup$
    – Öskå
    Commented Aug 8, 2014 at 9:54
  • 3
    $\begingroup$ BTW, see Differences reference.wolfram.com/language/ref/Differences.html $\endgroup$
    – DavidC
    Commented Aug 8, 2014 at 9:56
  • 1
    $\begingroup$ Be more precise and explain your problem clearly. If not, I'm afraid that your question might be closed for being unclear. $\endgroup$
    – Öskå
    Commented Aug 8, 2014 at 10:06
  • 5
    $\begingroup$ Here's the thing. If you want a good answer you have to ask a good question. You need to sit back and think about what you need help with, then edit your question and include every important detail that will help us understand clearly. Then we can offer you a solution. Otherwise trying to cut corners in asking a decent question will lead to more back and forth in the comment section that will eventually lead to this question being closed. $\endgroup$
    – RunnyKine
    Commented Aug 8, 2014 at 10:29
  • 2
    $\begingroup$ In addition to what @RunnyKine said, here's what actually happened: you ask a question that seems to be answered by Differences. Then it turns out what you actually want is a filter to replace data if (roughly) the gradient is higher than some value by some interpolated value. But this is only clear from reading the comments. It would help in getting an answer if you included the info from the comments in the question (maybe with a short version of your data and some rough attempt to do what you want). Basically, imagine you don't know what the question is. $\endgroup$
    – acl
    Commented Aug 8, 2014 at 10:37

3 Answers 3

1
$\begingroup$
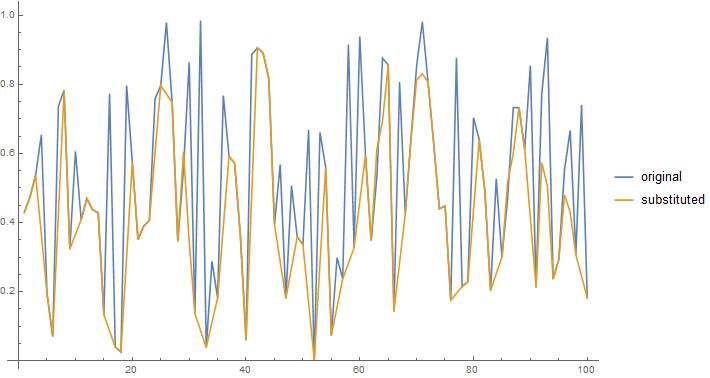
x = y = RandomReal[1, 100];

p = Position[Differences@x, n_Real /; n > 0.1] + 1 // Flatten;

Table[y[[n]] = (y[[n - 1]] + y[[n + 1]])/2, {n, {p}}];

ListLinePlot[{x, y},
 ImageSize -> 600,
 PlotLegends -> {"original", "substituted"}]

enter image description here

$\endgroup$
0
$\begingroup$

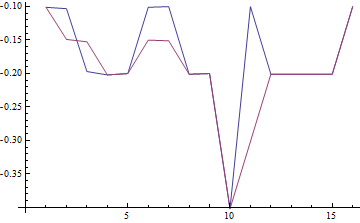
For example, modifying data if first value is > -0.2 :-

data = {{27.342, -0.01}, {27.443, -0.03}, {27.546, -0.01},
   {27.743, -0.01}, {27.945, -0.01}, {28.145, -0.03},
   {28.246, -0.05}, {28.346, -0.06}, {28.547, -0.01},
   {28.747, -0.01}, {29.149, -0.01}, {29.249, 0},
   {29.45, -0.01}, {29.651, -0.05}, {29.852, -0.05},
   {30.053, -0.01}, {30.153, -0.01}};

Length[data]

17

datapairs = Partition[data, 2, 1];

takedifferences[onepair_] := Module[{a, b},
  {a, b} = onepair;
  a - b]

diffs = Map[takedifferences, datapairs];

Length[diffs]

16

datatriples = Partition[diffs, 3, 1];

process[onetriple_] := Module[{a1, a2, b1, b2, c1, c2},
  {{a1, a2}, {b1, b2}, {c1, c2}} = onetriple;
  If[b1 > -0.2, b1 = Mean[{a1, c1}]];
  {b1, b2}]

processed = Join[{First[diffs]}, Map[process, datatriples], {Last[diffs]}];

Length[processed]

16

ListLinePlot[{First /@ diffs, First /@ processed}]

enter image description here

$\endgroup$
1
  • $\begingroup$ Added more thorough processing ;-) $\endgroup$ Commented Aug 8, 2014 at 11:25
0
$\begingroup$

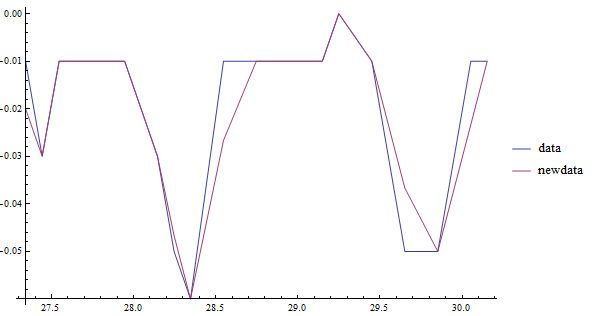
Perhaps something along the following lines?

data = {{27.342, -0.01}, {27.443, -0.03}, {27.546, -0.01}, {27.743, -0.01},
        {27.945, -0.01}, {28.145, -0.03}, {28.246, -0.05}, {28.346, -0.06},
        {28.547, -0.01}, {28.747, -0.01}, {29.149, -0.01}, {29.249,  0}, 
        {29.45, -0.01}, {29.651, -0.05}, {29.852, -0.05}, {30.053, -0.01},
        {30.153, -0.01}}; (* from @ChrisDegnen's answer *)

threshold = .02;
t = UnitStep @ PadLeft[Abs@Differences[data[[All, 2]]] - threshold, Length[data]];
mf = MeanFilter[data[[All, 2]], 1];
newdata = Transpose[{data[[All, 1]], (1 - t) data[[All, 2]] + t mf}];
ListLinePlot[{data, newdata},  PlotLegends -> {"data", "newdata"}]

enter image description here

$\endgroup$

Your Answer

By clicking “Post Your Answer”, you agree to our terms of service and acknowledge you have read our privacy policy.

Not the answer you're looking for? Browse other questions tagged or ask your own question.